by Peter Wagner,
August 23, 2004
The mayor of Marion Ohio — which contains a number of large prisons — was quoted in an article about our Importing Constituents: Prisoners and Political Clout in Ohio report as saying that he hasn’t noticed any added clout in the state capitol as a result of the Census Bureau counting state prisoners as residents of his town.
The mayor of one small town within a larger district is not likely to “notice” an increase in his town’s influence over state politics, but the discussion did remind me of a critical point I haven’t been making often enough: In a democracy, districts are supposed to belong to the constituents, not the politicians. When we get this backwards we reduce the constitutional principle of “one person one vote” to the meaningless “one politician per district”.
To show why this matters, let me use an example not discussed in our report but in the Marion Star article: the most recent redistricting of the Marion City Council. In 1996, city annexed nearby prisons which “meant a significant jump in the size of Marion City Councilman Ralph Cumston’s 1st ward”. The solution? “Splitting” two of the facilities off and “putting them in to 2nd ward Councilman Phil Hatch’s ward.”
Continue reading →
by Peter Wagner,
August 16, 2004
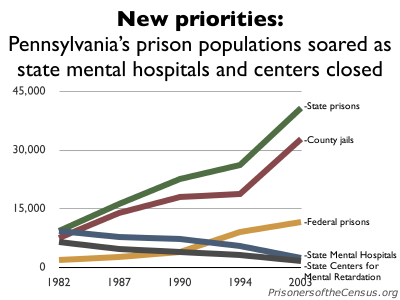
Like many other states, Pennsylvania has engaged in a huge prison building boom over the last 2 decades. And like in many other states, the locations of the prisons and the origin of the prisoners have been unevenly distributed throughout the state.
Source: Pennsylvania Institutional Law Project.
Pennsylvania built 2 state prisons in the 1960s, 1 in the 1970s and 5 in the 1980s. Prison construction exploded in the 1990s, with 11 new state facilities. Three more have been built or are under construction since.
Pennsylvania’s federal prisons grew quickly as well. The Penitentiary at Lewisburg opened in 1932, and a facility was added in the 1960s, the 1970s, two in the 1980s and 4 in the 1990s. Pennsylvania is only 4% of the U.S. population, but houses 8% of the nation’s federal prisoners.
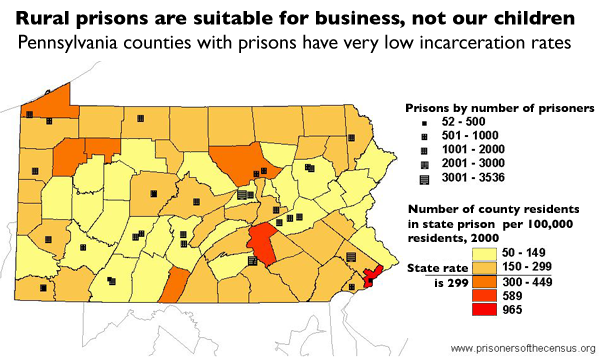
Rural Pennsylvania harvests the majority of the prisons, but few of the prisoner seeds come from the rural counties that host the prisons. Twelve percent of the state lives in Philadelphia, but 40% of the state’s prisoners are from the city. No state prisoners are incarcerated within Philadelphia and only 52 prisoners were reported in the federal facility in the city.
The overall Pennsylvania incarceration rate of 299 prisoners per 100,000 residents is lower than the national average, but this rate is far from even throughout the state. The incarceration rate for Philadelphia residents is 965 per 100,000 residents, more than 3 times the state average. The overwhelming majority of the prisons in the state are located in counties that incarcerate their residents at less than, or markedly less than, the state average.
It would appear that incarceration might be good for business in these rural counties, but these same counties view incarceration as anything but positive for their actual residents.
For more on prisoners and the census in Pennsylvania, see also: Prisoners and the 2000 Census by Robert T. Hoetzel; Felon Disenfranchisement: Pennsylvania’s Sinister Face of Vote Dilution, by Jon E. Yount; and Too Big to Ignore: How counting people in prisons distorted Census 2000 by Rose Heyer and Peter Wagner.
by Peter Wagner,
August 9, 2004
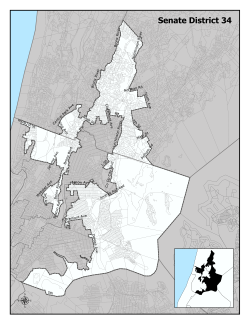
District 34 as shown on the New York Senate’s official map. It took me over a year and to find Rikers Island on this map because the boundaries were unrecognizable. (Larger version.)
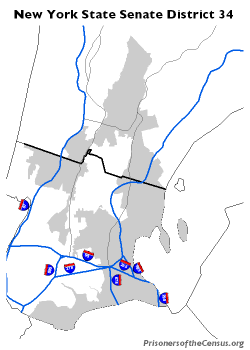
I made this map. The Bronx-Westchester border is emphasized and the major highways added.
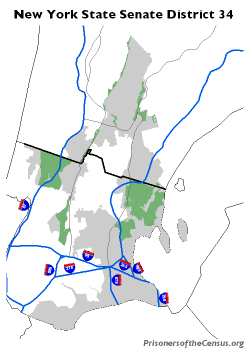
This map includes the major parks. (Note how the parks “orphan” portions of the district and make it less contiguous.)
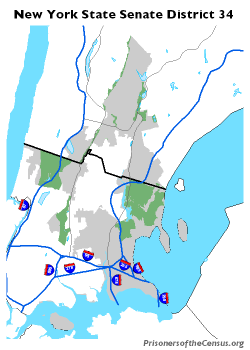
Adding in the open water reveals the actual shape of the district.
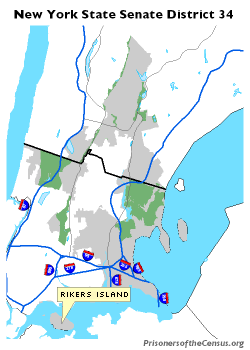
This oddly shaped district includes the nearly 13,000 detainees on Rikers Island who are legally resident elsewhere. (Larger version.)
New York State Senate District 34 was discussed in the column last week. This district straddles the border between Bronx County in New York City and suburban Westchester County. If the New York City residents in state prisons had been counted at home rather than in upstate prisons, the Bronx side of the border might have been populous enough to dominate the district. District 34 also has a remarkable shape and story. The New York Times described the shape as “a doughnut that has had a bite taken out of it and then been run over by a car”. The district was apparently created to include many white communities, while excluding the African-American community in the center as well as the home of a political opponent of the incumbent. (See original map at right.)
The district configuration was a hotly contested issue at the redistricting taskforce meeting in the Bronx that I testified at in March 2002. I maintained that even though the U.S. Census currently counts prisoners as if they were permanent residents of the state prison, the New York State Constitution requires an adjustment to Census Bureau data. The prisoners should be counted back at their home addresses because their legal residence does not change during incarceration. Without this population adjustment, New York City loses 43,740 residents to the upstate areas that contain state prisons.
Because the district maps prepared for the hearing did not include cultural and geographic features, no one present noticed the population elephant hiding in the corner. This article suggests an alternative way of looking at district data and the question of whether District 34 represents a single cohesive community.
The second map at right approximates the layout of the official District 34 map, with the local major highways added and a dark border between the Bronx and Westchester Counties. (Westchester is to the north of the dark line.) The third map includes the major parks and the fourth map includes the open water.
The grey oval at the bottom of the last map is the population elephant: Rikers Island, the largest penal colony in the world. Senate District #34 snakes down through the Bronx to include the 12,780 people on Rikers Island. (According to Census data, 7,897 are Black and 3,443 are Hispanic.) Very few of the Rikers Island detainees are permanent residents of District 34, and yet they were counted there for redistricting purposes.
Two-third of the people on Rikers Island are pre-trial detainees. These detainees retain the right to vote but are required to do so via absentee ballot back in their home districts. Any persons actually serving felony time on Rikers have lost their right to vote. None of the incarcerated people counted on Rikers Island are voting there.
Senate District 45 in northern New York includes 12 state prisons and the largest number of state prisoners, but Rikers Island, by itself, has just a few hundred less. And while the average state prisoner has been in their current prison for almost 7 months, the average stay on Rikers Island is only 39 days. And unlike state prisons which shuffle prisoners around frequently until their sentences expire, the next stop after Rikers is frequently home.
Upstate Senators have boasted that while they do get letters from prisoners with complaints, they are free to ignore these “constituents”. But the Senator who represents District 34 has an even better deal: None of the 13,000 phantom residents of Rikers Island cast a vote there, and the senator from District 34 is about the last person a temporary detainee will think to write to.
After all, District 34 is a district dominated by Westchester County. The only way on or off Rikers Island is the bridge that connects it to Queens.
Large jail populations counted in the Census can be just as important as large prisons when it comes to diluting the votes of neighborhoods with large numbers of incarcerated people.
by Peter Wagner,
August 2, 2004
Below is a map of New York Senate district 34. The boundary line of this district was the subject of a lawsuit arguing that it was drawn to dilute the voting strength of Blacks and Hispanics.
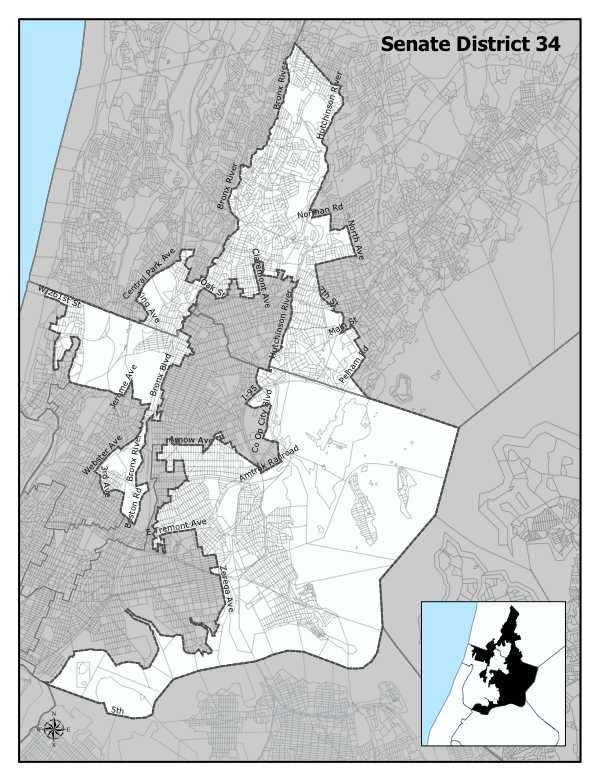
New York State Senate District 34 is dominated by Westchester county. Bronx residents were included to bring the district population up to the required size.
The Prisoners of the Census project maintains that miscounting urban prisoners as rural residents under-represents urban areas and over-represents rural areas. This causes a domino effect on the location of legislative district boundaries. (See the start of such a domino effect moving southwards from a prison-heavy district in the northeast corner of New York State in this series of maps.)
Continue reading →
by Peter Wagner,
July 26, 2004
Our project, Prisoners of the Census, addresses the political impact of the Census Bureau’s policy of counting prisoners where they are incarcerated, not at home. In some cases, a large population is transferred to prison towns, but the potential impact of prisoner miscount can be large even when the number of prisoners transferred is small.
This example will illustrate how small changes in district boundary lines – even without errors in the underlying Census data — can determine which party or group controls the government. If the underlying Census data is distorted, the potential impact could be far larger.
Continue reading →
by Peter Wagner,
July 19, 2004
As I wrote in May, there are 3 ways to fix how the U.S. Census counts prisoners:
- The Census could change its methodology
- States could adjust the counts after the fact
- States can ignore the federal Census and bring back their state Censuses.
The first option is the best, but the others are far more practical than they may sound at first glance. One state already does something quite similar: Kansas adjusts how students and the military are counted.
In 2001, Texas Representative Harold Dutton introduced a bill to restore Texas prisoners to their home addresses prior to redistricting. Although the bill was not ultimately successful, the bill was approved by the Elections committee and does illustrate one approach that could be taken by states if the Census Bureau does not change its policy.
The bill would have required the operators of all public and private prisons in Texas to submit to the Texas Controller a report containing the name, age, gender, ethnicity and pre-incarceration address of each person counted in the Census as a resident of the prison. The Controller would then deduct these persons from the Census tracts with the prisons and restore them to their home Census tracts.
Continue reading →
by Peter Wagner,
July 12, 2004
As described in last week’s column, how the Census Bureau counts prisoners undercounts Ohio’s urban areas while boosting the population of the rural areas that host the prisons. Also skewed is how much representation each region receives in the state legislature, because Ohio relies on Census Bureau data to redraw its state legislative boundaries
States are required to redraw their legislative boundaries each decade so that each will contain the same number of people as required by the 14th Amendment’s One Person One Vote principle. Equally sized districts ensure that each resident has an equal access to government regardless of where she or he lives.
The Census counts everyone including people who can’t vote such as prisoners and children. But children are at least a part of the surrounding community and share some common interests with it. Children can with some confidence rely on their neighboring adults to represent their interests. But prison communities are often very closely aligned with the prison industry and are likely to be quite dissimilar to the communities that the prisoners came from.
So while prisoners are barred from voting for or against the legislator that “represents” them while they are incarcerated, Ohio restores a prisoner’s right to vote on the day that he or she is released. But that is also the same day that the former prisoner will be getting on a bus to leave the prison district and return back home.
Continue reading →
by Peter Wagner,
July 5, 2004
The Census Bureau counts prisoners not at their homes but as if they were residents of the town that contained the prison. This administrative quirk reduces the population of the urban communities where most prisoners originate and swells the population of the rural communities that house prisons. Ohio now incarcerates more than 3 times as many people as it did as recently as 1980, making what would once be a trivial issue into a critical one.
Urban areas suffer, prison counties gain
All of Ohio’s major cities see a reduction in their Census population from how prisoners are counted. Although there are small state prison facilities in Cuyahoga County (Cleveland) Montgomery County (Dayton) and Franklin County (Columbus) the small gain is overshadowed by the loss. Cuyahoga County has 11,167 residents in prison with 10,441 incarcerated in other counties. The Census shows Hamilton County with 5,235 fewer people. This population is instead credited to the counties that contain the prisons. Pickaway County has a Census population of 53,437, but 5,583 of those people are actually prisoners from other parts of the state.
Thankfully, Census Bureau policy on how to count the population is not fixed, instead it responds to changing needs. When evolving demographics meant more college students studying far from home and more Americans living overseas, the Census policy changed in order to more accurately reflect how many Americans were living where. Today, the growth in the prisoner population requires the Census to update its methodology again. Otherwise, Ohio’s urban communities are going to find themselves shortchanged in the 2010 Census.
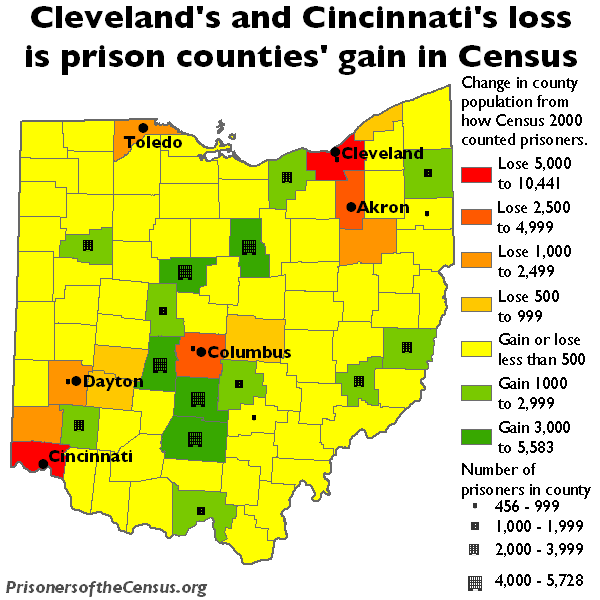
Figure 1. Ohio’s largest cities lose sizable population to a Census Bureau quirk that counts the incarcerated as if they lived in their remote prison cells.
Source: Peter Wagner and Rose Heyer Importing Constituents: Prisoners and Political Clout in Ohio
by Peter Wagner,
June 28, 2004
In 1894, Michael Cady tried to register to vote using his address at the Tombs Jail in New York City. Jail inmates are allowed to vote, but he was convicted for illegal registration because the NY Constitution says that
“no person shall be deemed to have gained or lost a residence, by reason of his presence or absence … while confined in any public prison.”
The prosecution’s theory was that while Cady was allowed to vote, he could not vote in the prison district. Even though Cady was planning on staying at the Tombs forever, Cady must have — the prosecution argued — lived somewhere else before.
The highest court in New York agreed:
“The Tombs is not a place of residence. It is not constructed or maintained for that purpose. It is a place of confinement for all except the keeper and his family, and a person cannot under the guise of a commitment … go there as a prisoner, having a right to be there only as a prisoner, and gain a residence there.”
When counting the population of each state, the federal Census counts the nation’s mostly urban prisoners as if they were residents of the rural towns with the prisons. When the Census first started in 1790 with the purpose of dividing Congressional seats among the states, that probably made sense. But today one of the biggest users of Census data is state legislatures that must redraw their legislative districts each decade to comply with the Supreme Court’s “One Person One Vote” rule of equally sized districts. Relying on the Census Bureau to count the population sounds convenient and fair, but until the Census Bureau changes how it counts prisoners, using the federal Census data might not be the best way to insure that districts comply with the requirements of the 14th Amendment and how many state constitutions define residence.
If calling your jail cell your residence gets you sent to prison, shouldn’t it also be illegal for rural legislators to call prisoners their “constituents”?
Read more about Michael Cady in Importing Constituents: Prisoner and Political Clout in New York.
by Peter Wagner,
June 21, 2004
Each decade, the U.S. Census counts the population and then gives the counts to state legislatures for use in redistricting. Legislators take the data and redraw their districts so that each contains the same number of people. Equally sized districts ensure that each person in each district has an equal access to government. This practice is known as the “One Person One Vote” rule and has been the law of the land since the Supreme Court interpreted the 14th Amendment of the Constitution to require districts of equally sized populations in the 1963 case Reynolds v. Sims.
The problem? Based on a methodology developed more than two centuries ago, the Census Bureau counts the nation’s now 2 million prisoners as if they lived at the prison. The method of counting other “special populations” has evolved over time, but the way that prisoners have been counted has gone unquestioned until recently.
Prisoners can’t vote and they are residents not of the prison town but of communities often very far and very different from the prison. While prisons are unquestionably big industries in many rural areas, the temporary physical presence of the prisoners does not make prisoners a part of the prison town in any legal or social sense.
Crediting rural towns with the prison population reduces the number of real rural residents required for a district. This boosts the weight of rural votes while diluting the strength of a vote in the prisoner’s home district.
Continue reading →


