Kansas’ redistricting data was once again skewed after the 2020 Census; the state needs to take action to fix the issue for 2030

by Aleks Kajstura, June 25, 2025

Everyone in Kansas is supposed to have an equal voice in their government’s decisions, but an outdated and misguided Census Bureau policy that counts incarcerated people in the wrong place gives a few residents of the state a megaphone. It is a problem known as prison gerrymandering, and Kansas lawmakers can fix it.

Kansas blindly follows outdated bureaucratic federal policy

Every ten years, when the Census Bureau conducts its official tally of the nation’s population, it incorrectly counts incarcerated people as residents of prison cells rather than in their home communities. This is despite the fact that they usually are not from the prison town, have no family or social ties there, likely won’t stay there for long, and state residence law says they’re not residents there. When state officials then use that incorrect Census data in the legislative redistricting process, they inadvertently inflate the populations of those areas — in violation of constitutional principles of equal representation. This gives residents of state legislative districts that contain correctional facilities a particularly loud voice in government, allowing them to have an outsized influence on debates about mail-in ballots, abortion, beer sales, defining new crimes, college admission standards, and more, at the expense of nearly every other person in the state.

Counting incarcerated people correctly matters; so states across the country have taken steps to fix the problem that the Census Bureau created. But, Kansas is one of the remaining states still suffering from this “prison gerrymandering.” While the 2030 Census count is still years away, Kansas needs to act now to avoid prison gerrymandering the next time it redraws its districts.

Prison gerrymandering significantly distorts Kansas’ state legislative districts

In Kansas, there are four state House districts that powerfully illustrate how prisons distort district populations and give some residents a louder voice in government as a result of prison gerrymandering.

In these four state House districts — districts 40, 41, 102, and 75 — correctional facilities account for as much as 11% of the population. In District 40, for example, correctional facilities make up roughly 11% of the population. That means that just 89 residents of that district have as much political clout as 100 residents in any other district. That imbalance in representation comes from the state choosing to redistrict based on Census numbers that don’t match the reality of where people live.

Four most prison-gerrymandered State House Districts in Kansas:

These four districts are the most prison-gerrymandered in Kansas. For details on all districts, see the Appendix
District District Location Notable facilities Percent of the district that is incarcerated
40 Part of Leavenworth County Lansing Central Correctional Facility, Leavenworth Detention Center 10.9%
41 Part of Leavenworth County FCI and FPC Leavenworth, United States Disciplinary Barracks, Midwest Joint Regional Correctional Facility 10.3%
102 Part of Reno County Hutchinson Correctional Facility, Reno County Jail 7.0%
75 Part of Butler County El Dorado Correctional Facility 6.9%

These four districts are the most prison-gerrymandered state legislative districts in Kansas. Large chunks of their population are made up of prisons that contain people from other parts of the state (or other states), instead of local residents. State facilities regularly contain people who are incarcerated far from home, have no ties to the communities where the facilities are located, and are moved regularly between facilities for administrative convenience.

Even worse, the largest facilities in District 41 don’t contain Kansas residents. The FCI and FPC Leavenworth facilities are used by the Federal Bureau of Prisons, and the United States Disciplinary Barracks (USDB), and Midwest Joint Regional Correctional Facility are used by U.S. Army and hold people from all over the country. e don’t know precisely where the people held at the Army’s correctional facilities live, however, we do have data from the Bureau of Prisons that provides some insights. Less than 1% of the Bureau of Prisons population comes from Kansas, which means out of the 1,724 people held by the Bureau of Prisons at the FCI and FPC Leavenworth facilities, only about 12 people are likely Kansas residents. And of those 12 Kansas residents, it’s unlikely that even one person would be an actual resident of District 41.

Prison gerrymandering disproportionately harms Kansas’ Black and Native American residents

Prison gerrymandering reduces the political power of nearly all Kansas residents by allowing a few districts with large correctional facilities to claim residents from all over the state. And while it does that, it also enshrines the racial inequities of mass incarceration into the state’s legislative districts.

The racial impact of prison gerrymandering is so strong in Kansas that 60% of the Black people counted in District 75 were actually behind bars, rather than living in the community.

The district’s population is so distorted because, in Kansas, like across the country, mass incarceration has a disproportionate impact along racial lines. In Kansas, Black residents are incarcerated at disproportionate rates and, therefore counted in the wrong place more often than Kansas’ white residents.

Black residents make up 5% of the state population, but a whopping 27% of people in prisons and 25% of people in jails. That means they are incarcerated at roughly five times the rate you would expect based on their population.

Native American residents are also disproportionately impacted, making up just half of one percent of the state population but 2% of people in prisons and 1% of people in jails. That means they are incarcerated at roughly four times the rate you would expect based on their population.

Counting incarcerated people in the wrong place adds up. Just in the four districts highlighted above, nearly 2,800 Black people were counted in the wrong place. This means that the Census Bureau policies are effectively silencing the voices of a large portion of the state’s Black residents.

Kansas law says a prison cell is not a residence. Census Bureau policy disagrees

Not only does the Census Bureau’s redistricting data cause prison gerrymandering, it also doesn’t comply with Kansas’ law. The state’s statute on voting residence — determining where someone is represented — is clear that just being present in a place doesn’t make you a resident there. It explicitly requires a person to have “adopted” it as their home and intend to return there when absent:

“Residence” means the place adopted by a person as such person’s place of habitation, and to which, whenever such person is absent, such person has the intention of returning.

Kansas Statutes § 25-407

Most incarcerated people don’t “adopt” their cell — or the surrounding community — as their home. Incarcerated people don’t generally stay in the area of the prison after their release and almost always go back to the communities they came from — if not the exact address they lived at before their arrest. So, under Kansas law, they aren’t residents of the facility location.

Instead of following state law, though, the Census Bureau follows its own “residence rule” to choose where to count incarcerated people — where they “live and sleep most of the time.” But it doesn’t even follow this rule properly when it comes to counting incarcerated people.

The Census Bureau counts incarcerated people at the location of the facility where they happen to be held on Census Day under the mistaken belief that that is where incarcerated people “live and sleep most of the time.” The facts, however, do not support its interpretation of its own definition of residence. It is well-established that in the modern era of mass incarceration, incarcerated people do not “live and sleep most of the time” at the facility where they are held on any given day (including Census Day). Nationally, 75% of people serve time in more than one prison facility, and 12% of people serve time in at least five facilities before returning home.

Kansas is long overdue to correct its redistricting data to match its residence law and the realities of where incarcerated people actually reside.

Kansas recently modernized its approach to counting college students and military members — now it needs to do so for incarcerated people

Adjusting redistricting data to count people at home may already sound familiar, because until 2019, Kansas surveyed college students and members of the military to pick a “permanent” residence for redistricting purposes. The state would use those answers to adjust the population numbers from the Census Bureau — a holdover from when the state conducted its own census entirely. But by the end of the last decade, it became clear that approach no longer made sense — it was a costly solution to a problem that no longer existed.

For one, the Census itself changed its own approach to counting deployed military — they are now counted at their “usual residence” — where they eat and sleep most of the time — which also happens to be the where they intend to return to after deployment, and so matches their residence under Kansas law. That change also makes sense because military personnel and their families are integral members of their home communities and should be counted as part of that community, even when deployed for extended periods.

Secondly, Kansas updated its understanding of where college students actually live, now matching its own residence law with the Census Bureau’s residence criteria. Kansas’ approach to counting students used to result in students being counted at their parents’ address for the duration of the time they lived at college. That approach may have made sense historically, but the majority of students today remain near the college after graduation. In fact, the Census Bureau followed those trends and changed where it counts students — from their parents’ house to their school address — in 1950. So now Kansas uses Census Data to count students where they live — at the college.

So while the Census Bureau’s count of college students and military now aligns with Kansas’ residence law and general concept of what counts as home, the same is not true for incarcerated people.

Of course, cost concerns were one of the reasons why Kansas finally stopped adjusting student and military populations. But those high costs were a result of the state’s process of individually surveying every college student and military member in the state; and that process is not applicable to fixing how incarcerated people are counted. States that count incarcerated people at home1 do so relatively inexpensively, using existing administrative records, and often within existing staff capacities.

In fact, some local governments in Kansas have already started adjusting their redistricting populations to avoid prison gerrymandering their own city council and county commissioner districts.

Some local governments are already tackling prison gerrymandering on their own

The impact of prison gerrymandering is clearly visible at the small scale: city and county governments.

For example, in Reno County, there is a County Commissioner district where incarcerated people account for 13% of the district’s population. The district contains the Hutchinson Correctional Facility. The result is that 87 people in that district have the same power as 100 people in the other four commissioner districts.

Facing these absurd distortions in representation, some of Kansas’ local governments have already started taking matters into their own hands and rejecting the Bureau’s way of counting incarcerated people. In the two latest redistricting cycles, at least two local governments in Kansas have avoided prison gerrymandering to ensure their residents have equal representation in local government: Lansing City and Leavenworth County2.

In most cases, adjusting redistricting data to avoid prison gerrymandering is quite easy for local governments. However, the state can provide a more efficient and complete solution for its local governments. Although it is not fair that the state has to correct for this federal issue, the state is in a better position to take on that burden than each individual city and county.

Nationally, state and local governments are addressing the problem, but Kansas is lagging behind

Over the course of the last few decades, over 200 local governments and a growing number of states, have taken action on their own to fix this problem. Nearly half of the US population now lives in a place that corrects redistricting data they receive from the Census to avoid prison gerrymandering.

States that have ended prison gerrymandering on their own include deep “blue” states like California, “purple” states like Maine and Pennsylvania, and deep “red” states like Montana — where prison gerrymandering-reform legislation received wide bipartisan support. But Kansans are falling behind, letting the state’s democracy continue to be skewed by an outdated federal system.

Kansas needs to take action now

Adjusting redistricting data to avoid prison gerrymandering is now a well-tested strategy with a proven track record. In fact, the bipartisan National Conference of State Legislatures called this effort “the fastest-growing trend in redistricting.” Kansas can now confidently pass legislation to count incarcerated people at home for redistricting purposes. Other states have already been successful in these efforts, paving the way for Kansas. The state would also have the benefit of refining its approach based on lessons learned by states that have gone through the process before. And it is easier than ever for states to act; even the Census Bureau is starting to acknowledge the problem and help.

2030 may seem far away, but other states have learned that the earlier that reforms are put in place, the less expensive, easier to produce, and more accurate the final redistricting data becomes. Every state has a different legislative approach to ending prison gerrymandering, but as a practical matter, this model bill, prepared by a coalition of civil rights, voting rights, and criminal justice organizations, is a great place to start. It provides clear guidance on how this data should be collected, by whom, and how it will be used for the redistricting process.

In the 2020 redistricting cycle, Kansas was finally able to rely on the Census Bureau to count college students and military members at home. However, to count incarcerated people at home, Kansas still needs to start doing so itself. The Census Bureau is unlikely to change its policies about how to count incarcerated people in time for the 2030 Census, meaning that unless Kansas acts quickly, the state will once again be driven into prison-gerrymandering their legislative districts.

Kansas needs to end prison gerrymandering now.

About the Data

Correctional Facility Populations: To calculate the percentage of each district’s population that was in correctional facilities, we used the redistricting data (PL 94-171) from the 2020 Census. Table P1 provides the total population for each Census block and Table P5 provides the number of incarcerated people for each Census Block. Notably, this approach includes people in all kinds of correctional facilities, including state prisons, federal prisons, private prisons, local jails, halfway houses, etc.

Identifying specific facilities: Table P5 provides the population of correctional facilities without distinguishing between state, federal, or private facilities and it is published for each Census block. Census blocks do not necessarily translate directly to facilities, as some facilities are counted in multiple blocks and some blocks contain multiple facilities. To aid redistricting officials and advocates with using this data, the Prison Policy Initiative maintains a Facility Locator Tool that contains annotations of most of the Census blocks in the country that contain correctional facilities. These annotations rely on publicly-available data to identify facility names and types in each of these blocks.

Calculating how many Kansas residents are held by the Bureau of Prisons:
Our calculations on the number of people in federal prisons in each state are based on data provided by the Bureau of Prisons in response to our periodic Freedom of Information Act requests.

How this report quantifies prison gerrymandering compared to other analyses: There are a few ways to calculate the impact of prison gerrymandering, so other researchers may have used slightly different approaches that generate slightly different numbers for the same general problem. For example, some analyses only focus on prisons and exclude jail populations. That choice makes sense when looking at state-level policies and state districts because people in jails are very likely to also live in the legislative district where the jail is located. However, for this analysis, we included jails as well as state correctional facilities because 18% of the people in Kansas’ jails are held for state and federal authorities. Still other approaches, such as that taken by the Redistricting Data Hub, are based on estimates of incarcerated people’s home addresses. That approach adds an additional level of precision for counting people held in state facilities because it seeks to not only address where these people were counted incorrectly — which accounts for the bulk of prison gerrymandering’s population distortion — but to also estimate where they should have been counted. Unfortunately, this approach isn’t able to reflect where people in federal facilities, most jails, and private facilities are from. And so, for simplicity, this report doesn’t use that approach.

Each of these approaches has its own merits, and none are universally better than others; they all highlight different aspects of how prison gerrymandering skews population numbers, and each has its own use. The complexities inherent in the current patchwork approach to identifying and solving prison gerrymandering point to the need for the Census Bureau to count incarcerated people at home in the first place in order to provide a comprehensive solution to prison gerrymandering.

Appendix: Correctional facility populations in Kansas State House Districts, 2020 Census

State House District Total Population Incarcerated Population Percent of the District that is Incarcerated
1 23,705 31 0.1%
2 22,863 62 0.3%
3 24,113 0 0.0%
4 23,030 35 0.2%
5 23,522 0 0.0%
6 23,102 0 0.0%
7 23,741 0 0.0%
8 23,313 0 0.0%
9 23,244 43 0.2%
10 23,042 0 0.0%
11 23,072 45 0.2%
12 23,135 1 0.0%
13 22,781 211 0.9%
14 22,977 0 0.0%
15 22,856 159 0.7%
16 23,745 0 0.0%
17 23,226 0 0.0%
18 23,693 0 0.0%
19 24,080 0 0.0%
20 23,650 0 0.0%
21 23,871 0 0.0%
22 23,899 0 0.0%
23 24,042 0 0.0%
24 23,314 0 0.0%
25 24,050 0 0.0%
26 23,543 0 0.0%
27 23,335 0 0.0%
28 23,453 0 0.0%
29 24,071 0 0.0%
30 23,578 0 0.0%
31 23,924 0 0.0%
32 23,900 290 1.2%
33 24,314 0 0.0%
34 24,230 0 0.0%
35 24,209 286 1.2%
36 23,783 0 0.0%
37 23,201 0 0.0%
38 23,097 0 0.0%
39 22,663 0 0.0%
40 23,973 2611 10.9%
41 23,430 2404 10.3%
42 23,075 144 0.6%
43 23,744 723 3.0%
44 24,346 0 0.0%
45 23,558 0 0.0%
46 23,753 0 0.0%
47 22,746 34 0.1%
48 23,506 0 0.0%
49 23,860 0 0.0%
50 23,076 0 0.0%
51 22,839 0 0.0%
52 23,602 0 0.0%
53 23,144 0 0.0%
54 22,912 0 0.0%
55 23,517 0 0.0%
56 23,535 0 0.0%
57 23,487 1327 5.6%
58 23,516 0 0.0%
59 22,916 44 0.2%
60 22,790 83 0.4%
61 23,108 85 0.4%
62 23,099 9 0.0%
63 23,858 57 0.2%
64 23,186 142 0.6%
65 23,511 0 0.0%
66 24,145 0 0.0%
67 23,696 65 0.3%
68 23,694 88 0.4%
69 24,131 0 0.0%
70 22,912 19 0.1%
71 24,005 276 1.1%
72 23,363 88 0.4%
73 23,632 0 0.0%
74 22,927 0 0.0%
75 23,998 1649 6.9%
76 23,181 2 0.0%
77 24,094 0 0.0%
78 23,056 0 0.0%
79 23,609 674 2.9%
80 23,973 66 0.3%
81 23,040 0 0.0%
82 23,223 0 0.0%
83 24,120 0 0.0%
84 23,539 0 0.0%
85 23,565 0 0.0%
86 24,159 0 0.0%
87 23,768 0 0.0%
88 23,527 0 0.0%
89 24,153 0 0.0%
90 23,547 0 0.0%
91 24,248 0 0.0%
92 23,647 0 0.0%
93 22,688 0 0.0%
94 23,075 0 0.0%
95 23,956 161 0.7%
96 22,823 0 0.0%
97 23,588 0 0.0%
98 23,362 0 0.0%
99 23,491 0 0.0%
100 23,853 0 0.0%
101 23,265 0 0.0%
102 23,668 1668 7.0%
103 23,991 1470 6.1%
104 23,650 0 0.0%
105 23,307 0 0.0%
106 23,174 14 0.1%
107 24,305 57 0.2%
108 24,157 0 0.0%
109 23,076 927 4.0%
110 22,587 1001 4.4%
111 24,121 31 0.1%
112 22,577 70 0.3%
113 23,990 19 0.1%
114 23,846 18 0.1%
115 23,901 36 0.2%
116 23,588 12 0.1%
117 23,087 0 0.0%
118 23,583 34 0.1%
119 23,670 97 0.4%
120 23,310 24, 0.1%
121 23,004 0 0.0%
122 22,931 629 2.7%
123 22,957 78 0.3%
124 23,685 51 0.2%
125 23,208 54 0.2%

Table notes

Total Population
Total population reported for all blocks in the district (as redistricted in 2022). Block populations reported for the 2020 Census in the PL 94-171 redistricting summary files Table P1.
Incarcerated Population
Total incarcerated population reported in all blocks in the district (as redistricted in 2022), based on the incarcerated population in group quarters reported for the 2020 Census in the PL 94-171 redistricting summary files Table P5
Percent of the District that is Incarcerated
This is the number of incarcerated people counted in the district divided by the total population of the district.

See the full appendix

Footnotes

  1. In fact, nearly 20 states now make some adjustments to their redistricting data to account for incarcerated people. And states are still actively improving their processes rather than going back to using unadjusted Census data.  ↩

  2. Nationwide we identified over 200 local governments that avoided prison gerrymandering after the 2000 and 2010 Censuses (decades when zero and two, respectively, states adjusted their redistricting data to count people at home). This decade we limited the scope of our research but still found an additional 21 local governments scattered across 10 states that started doing so after the 2020 Census despite those states continuing to use unadjusted data for state-level districts.  ↩


West Virginia’s redistricting data was once again skewed after the 2020 Census; the state needs to take action to fix the issue for 2030.

by Aleks Kajstura, June 12, 2025

Everyone in West Virginia is supposed to have an equal voice in their government’s decisions, but an outdated and misguided Census Bureau policy that counts incarcerated people in the wrong place gives a few residents of the state a megaphone. It is a problem known as prison gerrymandering, and West Virginia lawmakers can fix it.

West Virginia blindly follows outdated bureaucratic federal policy

Every ten years, when the Census Bureau conducts its official tally of the nation’s population, it incorrectly counts incarcerated people as residents of prison cells rather than in their home communities. This is despite the fact that they usually are not from the prison town, have no family or social ties there, likely won’t stay there for long, and state residence law says they’re not residents there. When state officials then use that incorrect Census data in the legislative redistricting process, they inadvertently inflate the populations of those areas — in violation of constitutional principles of equal representation. This gives residents of state legislative districts that contain correctional facilities a particularly loud voice in government, allowing them to have an outsized influence on debates about regulating food, data center development, voting restrictions, sentencing for drug-related offenses and more, at the expense of nearly every other person in the state.

That is why states across the country have taken steps to fix the problem that the Census Bureau created. But, West Virginia is one of the remaining states still suffering from this “prison gerrymandering.” While the 2030 Census count is still years away, West Virginia needs to act now to avoid prison gerrymandering the next time it redraws its districts.

Prison gerrymandering significantly distorts West Virginia’s state legislative districts

In West Virginia, there are three House of Delegates districts that powerfully illustrate how prisons distort district populations and give some residents a louder voice in government as a result of prison gerrymandering.

In these three House of Delegates districts — districts 83, 45, and 63 — correctional facilities account for as much as 18% of the population. In District 83, for example, correctional facilities make up roughly 18% of the population. That means that just 82 residents of that district have as much political clout as 100 residents in other districts. That imbalance in representation comes from the state choosing to redistrict based on Census numbers that don’t match the reality of where people live.

Three most prison-gerrymandered House of Delegates Districts in West Virginia:

These three districts are the most prison-gerrymandered in West Virginia. For details on all districts, see the Appendix
District District Location Notable facilities Percent of the district that is incarcerated
83 Part of Preston County USP Hazelton, FCI Hazleton, SFF Hazleton 18.4%
45 Parts of Raleigh and Wyoming FCI Beckley and Camp; Southern Regional Jail 12.6%
63 Braxton, part of Gilmer

FCI Gilmer & Camp, Central Regional Jail 10.6%

These three districts are the most prison-gerrymandered state legislative districts in West Virginia. Large chunks of their population are made up of prisons that contain people from other parts of the state — from every single county, in fact — and all over the country, instead of local residents. State and regional facilities regularly contain people who are incarcerated far from home, have no ties to the communities where the facilities are located, and are moved regularly between facilities for administrative convenience.

Even worse, the largest facilities in these districts don’t even contain West Virginia residents. The Hazelton, Beckley and Gilmer federal facilities are used by the Federal Bureau of Prisons to hold people from all over the country. Only about 0.5% of the Bureau of Prisons population comes from West Virginia, which means out of the 6,801 people held in federal facilities in these three districts, only about 41 people are likely West Virginia residents. And the chances of all or most of that group being actual residents of these three specific districts are incredibly slim.

Residents of other states shouldn’t be counted as part of a West Virginia district’s population. Simply put, being incarcerated in a specific facility doesn’t make someone a resident of the surrounding district.

Prison gerrymandering disproportionately harms West Virginia’s Black residents

Prison gerrymandering reduces the political power of nearly all West Virginia residents by allowing a few districts with large correctional facilities to claim residents from all over the state. And while it does that, it also enshrines the racial inequities of mass incarceration into the state’s legislative districts.

In West Virginia, like across the country, mass incarceration has a disproportionate impact along racial lines. In West Virginia, Black residents are incarcerated at disproportionate rates and, therefore, are counted in the wrong place more often than West Virginia’s white residents.

The racial impact of prison gerrymandering is so strong that, for example, over half of the Black people counted in House of Delegates District 66 were actually behind bars, rather than living in the community. They were held at the Huttonsville Correctional Center and Tygart Valley Regional Jail, so the vast majority of them were West Virginia residents who were counted away from their own West Virginia district.

Data on West Virginia’s own state prisons and regional jails — excluding the federal facilities in the state — shows the state’s Black residents are disproportionately impacted by the state’s incarceration policies.

Black residents make up just 3% of the state population, but a whopping 14% of people in prisons and 13% of people in jails. That is in stark contrast to the white population, which makes up 91% of the state but only 85% of the prison population and 86% of the jail population.

This means that the Census Bureau policies are effectively silencing the voices of a large portion of the state’s Black residents.

West Virginia law says a prison cell is not a residence. Census Bureau policy disagrees

Not only does the Census Bureau’s redistricting data cause prison gerrymandering, it also doesn’t comply with West Virginia’s law. In residence law, the intent to stay somewhere is a key component of determining residence. And that common legal principle was adopted by the West Virginia Supreme Court in State v. Beale nearly a hundred years ago. The court made clear that just being present in a place doesn’t make you a resident there. It explicitly requires a person to have an intent to reside there:

A change of residence or domicile depends upon intention. And, it is said that intention is the fundamental and controlling element.

State v. Beale, 104 W. Va. 617, 628 (1927)

Most incarcerated people don’t intend to live in prison or jail — or the surrounding community. Incarcerated people don’t generally stay in the area of the prison after their release and almost always go back to the communities they came from — if not the exact address they lived at before their arrest. So, under West Virginia law, they aren’t residents of the facility location.

Instead of following state law, though, the Census Bureau follows its own “residence rule” to choose where to count incarcerated people — where they “live and sleep most of the time.” But it doesn’t even follow this rule properly when it comes to counting incarcerated people.

The Census Bureau counts incarcerated people at the location of the facility where they happen to be held on Census Day under the mistaken belief that that is where incarcerated people “live and sleep most of the time.” The facts, however, do not support its interpretation of its own definition of residence. It is well-established that in the modern era of mass incarceration, incarcerated people do not “live and sleep most of the time” at the facility where they are held on any given day (including Census Day). Nationally, 75% of people serve time in more than one prison facility, and 12% of people serve time in at least five facilities before returning home.

Representation in local government is also harmed by prison gerrymandering

The impact of prison gerrymandering is also clearly visible at the small scale: city governments.

For example, in the city of Charleston, there is a City Council ward where incarcerated people account for 16% of the ward’s population. Ward 19 contains the Kanawha County South Central Regional Jail. The result is that 84 people in Ward 19 have the same power as 100 people in the wards that do not contain correctional facilities.1

Facing these absurd distortions in representation, local governments across the country are taking matters into their own hands and, rejecting the Bureau’s way of counting incarcerated people, even when states fail to act.
In most cases, adjusting redistricting data to avoid prison gerrymandering is quite easy for local governments. However, the state can provide a more efficient and complete solution for its local governments. Although it is not fair that the state has to correct for this federal issue, the state is in a better position to take on that burden than each individual city.

Nationally, state and local governments are addressing the problem, but West Virginia is lagging behind

Over the course of the last few decades, over 200 local governments and a growing number of states, have taken action on their own to fix this problem. Nearly half of the US population now lives in a place that corrects redistricting data they receive from the Census to avoid prison gerrymandering.

States that have ended prison gerrymandering on their own include deep “blue” states like California, “purple” states like Maine and Pennsylvania, and deep “red” states like Montana — where prison gerrymandering-reform legislation received wide bipartisan support. But West Virginia is falling behind, letting the state’s democracy continue to be skewed by an outdated federal system.

West Virginia needs to take action now

Adjusting redistricting data to avoid prison gerrymandering is now a well-tested strategy with a proven track record. In fact, the bipartisan National Conference of State Legislatures called this effort “the fastest-growing trend in redistricting.” West Virginia can now confidently pass legislation to count incarcerated people at home for redistricting purposes. Other states have already been successful in these efforts, paving the way for West Virginia. And the state would have the benefit of refining its approach based on lessons learned by states that have gone through the process before. And it is easier than ever for states to act; even the Census Bureau is starting to acknowledge the problem and help.

2030 may seem far away, but other states have learned that the earlier that reforms are put in place, the less expensive, easier to produce, and more accurate the final redistricting data becomes. Every state has a different legislative approach to ending prison gerrymandering, but as a practical matter, this model bill, prepared by a coalition of civil rights, voting rights, and criminal justice organizations, is a great place to start. It provides clear guidance on how this data should be collected, by whom, and how it will be used for the redistricting process.

The Census Bureau is unlikely to change its policies about how to count incarcerated people in time for the 2030 Census, meaning that unless West Virginia acts quickly, the state will once again be driven into prison-gerrymandering their legislative districts.

West Virginia needs to end prison gerrymandering now.

Appendix: Correctional facility populations in West Virginia House of Delegates Districts, 2020 Census

State House District Total Population Incarcerated Population Percent of the District that is Incarcerated
1 18,807 0 0.0%
2 18,831 0 0.0%
3 18,817 0 0.0%
4 18,830 0 0.0%
5 18,794 71 0.4%
6 18,747 0 0.0%
7 18,828 582 3.1%
8 18,566 1127 6.1%
9 18,524 678 3.7%
10 17,073 0 0.0%
11 17,145 0 0.0%
12 17,129 333 1.9%
13 17,055 0 0.0%
14 17,079 0 0.0%
15 18,037 0 0.0%
16 18,735 0 0.0%
17 18,103 562 3.1%
18 17,429 0 0.0%
19 18,791 0 0.0%
20 18,823 0 0.0%
21 18,803 0 0.0%
22 17,068 0 0.0%
23 17,069 621 3.6%
24 17,052 0 0.0%
25 18,791 0 0.0%
26 17,355 0 0.0%
27 17,560 0 0.0%
28 17,222 0 0.0%
29 17,069 0 0.0%
30 18,695 0 0.0%
31 18,829 449 2.4%
32 18,484 0 0.0%
33 18,831 0 0.0%
34 18,038 0 0.0%
35 17,696 0 0.0%
36 18,787 1881 10.0%
37 18,707 0 0.0%
38 18,822 0 0.0%
39 18,813 0 0.0%
40 18,809 838 4.5%
41 18,700 0 0.0%
42 18,821 0 0.0%
43 18,234 0 0.0%
44 18,778 95 0.5%
45 17,459 2203 12.6%
46 17,407 220 1.3%
47 18,023 0 0.0%
48 17,467 0 0.0%
49 17,080 0 0.0%
50 17,267 1058 6.1%
51 17,575 0 0.0%
52 18,594 0 0.0%
53 17,602 27 0.2%
54 18,830 113 0.6%
55 18,312 0 0.0%
56 17,557 407 2.3%
57 18,820 0 0.0%
58 18,126 0 0.0%
59 17,519 0 0.0%
60 18,765 0 0.0%
61 17,282 0 0.0%
62 17,076 0 0.0%
63 17,059 1810 10.6%
64 18,043 0 0.0%
65 17,961 0 0.0%
66 17,471 1636 9.4%
67 17,802 0 0.0%
68 18,804 0 0.0%
69 17,773 0 0.0%
70 17,814 0 0.0%
71 17,114 0 0.0%
72 17,065 0 0.0%
73 17,761 352 2.0%
74 17,863 0 0.0%
75 18,780 0 0.0%
76 18,506 0 0.0%
77 17,226 0 0.0%
78 18,617 682 3.7%
79 17,075 0 0.0%
80 17,185 0 0.0%
81 17,170 0 0.0%
82 18,796 0 0.0%
83 17,126 3158 18.4%
84 17,090 0 0.0%
85 17,738 0 0.0%
86 17,069 0 0.0%
87 17,367 0 0.0%
88 17,069 0 0.0%
89 18,753 251 1.3%
90 18,774 0 0.0%
91 18,125 0 0.0%
92 18,426 0 0.0%
93 17,159 0 0.0%
94 17,079 0 0.0%
95 17,300 0 0.0%
96 17,455 0 0.0%
97 17,074 515 3.0%
98 17,155 0 0.0%
99 17,514 0 0.0%
100 17,621 0 0.0%

Table notes

Total Population
Total population reported for all blocks in the district (as redistricted in 2022). Block populations reported for the 2020 Census in the PL 94-171 redistricting summary files Table P1.
Incarcerated Population
Total incarcerated population reported in all blocks in the district (as redistricted in 2022), based on the incarcerated population in group quarters reported for the 2020 Census in the PL 94-171 redistricting summary files Table P5
Percent of the District that is Incarcerated
This is the number of incarcerated people counted in the district divided by the total population of the district.

See the full appendix

About the Data

Correctional Facility Populations: To calculate the percentage of each district’s population that was in correctional facilities, we used the redistricting data (PL 94-171) from the 2020 Census. Table P1 provides the total population for each Census block and Table P5 provides the number of incarcerated people for each Census Block. Notably, this approach includes people in all kinds of correctional facilities, including state prisons, federal prisons, private prisons, local jails, halfway houses, etc.

Identifying specific facilities:Table P5 provides the population of correctional facilities without distinguishing between state, federal, or private facilities and it is published for each Census block. Census blocks do not necessarily translate directly to facilities, as some facilities are counted in multiple blocks and some blocks contain multiple facilities. To aid redistricting officials and advocates with using this data, the Prison Policy Initiative maintains a Facility Locator Tool that contains annotations of most of the Census blocks in the country that contain correctional facilities. These annotations rely on publicly-available data to identify facility names and types in each of these blocks.

Calculating how many West Virginia residents are held by the Bureau of Prisons:
Our calculations on the number of people in federal prisons in each state are based on data provided by the Bureau of Prisons in response to our periodic Freedom of Information Act requests.

How this report quantifies prison gerrymandering compared to other analyses: There are a few ways to calculate the impact of prison gerrymandering, so other researchers may have used slightly different approaches that generate slightly different numbers for the same general problem. For example, some analyses only focus on prisons and exclude jail populations. That choice makes sense when looking at state-level policies and state districts because people in jails are very likely to also live in the legislative district where the jail is located. However, for this analysis, we included jails as well as state correctional facilities because 23% of the people held in West Virginia’s jails are held for state and federal authorities. Still other approaches, such as that taken by the Redistricting Data Hub, are based on estimates of incarcerated people’s home addresses. That approach adds an additional level of precision for counting people held in state facilities because it seeks to not only address where these people were counted incorrectly — which accounts for the bulk of prison gerrymandering’s population distortion — but to also estimate where they should have been counted. Unfortunately, this approach isn’t able to reflect where people in federal facilities, most jails, and private facilities are from. And so, for simplicity, this report doesn’t use that approach.

Each of these approaches has its own merits, and none are universally better than others; they all highlight different aspects of how prison gerrymandering skews population numbers, and each has its own use. The complexities inherent in the current patchwork approach to identifying and solving prison gerrymandering point to the need for the Census Bureau to count incarcerated people at home in the first place in order to provide a comprehensive solution to prison gerrymandering.

Footnotes

  1. There is also a a work release facility located in Ward 8, accounting for 113 people counted there. That means every 95 people in Ward 8 have the same power as 100 people in wards that do not contain any facilities.  ↩


With Governor Governor Joe Lombardo's signature, and the legislature's unanimous support, the state improves its prison gerrymandering reforms.

by Aleks Kajstura, June 3, 2025

On Friday, Nevada Governor Joe Lombardo signed AB 477 into law. This bill updates Nevada’s 2019 law ending prison gerrymandering, by improving data collection and providing clearer guidelines for implementation. It passed both the House and Senate unanimously, continuing the emerging bipartisan trend of support for prison gerrymandering reform.

Prison gerrymandering is a problem created because the Census Bureau incorrectly counts incarcerated people as residents of their prison cells rather than their home communities. As a result, when states use Census data to draw new state or local districts, they inadvertently give residents of districts with prisons greater political clout than all other state residents.

The new bill requires the Department of Corrections to collect and maintain address records, age, and race and ethnicity data used in redistricting. That means the state will have the data it needs to implement the law already on hand by the time the 2030 Census arrives. And the bill gives clearer guidance to the State Demographer on how to handle missing address information and out-of-state residents when adjusting the redistricting data to end prison gerrymandering. Missing data is unfortunately quite common despite states’ best efforts (for example, because the federal Bureau of Prisons refuses to share address information with home states), so implementation is easier when data gaps are anticipated and planned for in advance.

The state passed prison gerrymandering reform in 2019, shortly before the last redistricting cycle. This meant that the state had a short time to implement the law, and struggled in doing so particularly because it didn’t already have all of the address records it needed to count incarcerated people at home. In the end, the state managed to count about 64% of people in state prisons as residents of their home addresses, a great success given the limitations of its existing data, but the second-lowest success rate of the states that went through the same legislative reform process.

It’s not unusual for states to make improvements to their prison gerrymandering reforms. For example, California and Illinois have both updated their legislation to improve the home address data collection. The improvements that just passed in Nevada will ensure that the state’s implementation of prison gerrymandering reform is on par with its peers going forward.

The unanimous bipartisan support for this bill in the legislature and the Republican Governor’s signature show that states that end prison gerrymandering see the benefits of equal representation for all of their residents. In addition to Nevada, eighteen other states — including “red” states like Montana, “blue” states like New York, and “purple” states like Maine — have recognized the impact of prison gerrymandering on political representation and have taken action to provide more equal representation to their residents. Progress on this issue has been so swift that the staunchly bipartisan National Conference of State Legislatures recently called the movement to end prison gerrymandering “the fastest-growing trend in redistricting.”

As states like Nevada continue to improve their methods for ending prison gerrymandering, this victory is yet another reason for the Census Bureau to finally change how it counts incarcerated people and end prison gerrymandering nationwide.


Louisiana’s redistricting data was once again skewed after the 2020 Census; the state needs to take action to fix the issue for 2030.

by Aleks Kajstura, May 28, 2025

Everyone in Louisiana is supposed to have an equal voice in their government’s decisions, but an outdated and misguided Census Bureau policy that counts incarcerated people in the wrong place gives a few residents of the state a megaphone. It is a problem known as prison gerrymandering, and Louisiana lawmakers can fix it.

Louisiana blindly follows an outdated bureaucratic federal policy

Every ten years, when the Census Bureau conducts its official tally of the nation’s population, it incorrectly counts incarcerated people as residents of prison cells rather than in their home communities. This is despite the fact that they usually are not from the prison town, have no family or social ties there, likely won’t stay there for long, and state law1 says they’re not residents there. When state officials then use that incorrect Census data in the legislative redistricting process, they inadvertently inflate the populations of those areas — in violation of constitutional principles of equal representation. This gives residents of state legislative districts that contain correctional facilities a particularly loud voice in government, allowing them to have an outsized influence on debates about election laws, education, unemployment, gun laws, and more, at the expense of nearly every other person in the state.

That is why states across the country have taken steps to fix the problem that the Census Bureau created. But, Louisiana is one of the remaining states still suffering from this “prison gerrymandering.”

The legislative districts currently in place were deemed unconstitutional in 2024 for diluting representation for Black people, and prison gerrymandering makes the situation even worse than assumed by the court. This report analyzes the districts as drawn in 2022 since no new maps have been put in place, and it’s unclear whether they will be redrawn before the 2027 elections.

Louisiana needs to act now to avoid prison gerrymandering during the 2030 redistricting cycle — as well as the current court-ordered process.

Prison gerrymandering significantly distorts Louisiana’s state legislative districts

In Louisiana, there are three state House districts — districts 22, 18, and 32 — that powerfully illustrate how prisons distort district populations and give some residents a louder voice in government as a result of prison gerrymandering.

In District 22, for example, correctional facilities make up roughly 12% of the population. That means that just 88 residents of that district have as much political clout as 100 residents in any other district. That imbalance in representation comes from the state choosing to redistrict based on Census numbers that don’t match the reality of where people live. And Louisiana’s huge prison populations — only El Salvador incarcerates people at a higher rate — leave it especially vulnerable to the Census Bureau’s flawed prison counts.

Three most prison-gerrymandered State House Districts in Louisiana:

These three districts are the most prison-gerrymandered in Louisiana. For details on all districts, see the Appendix
State House District District Location Facilities in the district include Percent of the district that is incarcerated
District 22 Grant, and parts of La Salle, and Natchitoches Parishes Federal Correctional Complex Pollock, LaSalle Detention Facility, LaSalle Correctional Center, Natchitoches Detention Center 11.7%
District 18 Pointe Coupee, West Feliciana, and parts of Iberville, and West Baton Rouge Louisiana State Penitentiary 11.4%
District 32 Allen, and parts of Beauregard, Calcasieu, and Jefferson Davis Parishes Oakdale Federal Correctional Complex, Allen Correctional Center, Southwest Workforce Development Transitional Work Program 8.3%

These three districts are the most prison-gerrymandered state legislative districts in Louisiana. Large chunks of their population are made up of prisons that contain people from other parts of the state (or other states), instead of local residents. State facilities regularly contain people who are incarcerated far from home, have no ties to the communities where the facilities are located, and are moved regularly between facilities for administrative convenience.

Even worse, the largest facilities in Districts 22 and 32 don’t contain Louisiana residents — they are used by the Federal Bureau of Prisons to hold people from all over the country. Only about 1% of the Bureau of Prisons population comes from Louisiana, which means out of the thousands of people held by the Bureau of Prisons in those districts, only about 46 people are likely Louisiana residents. And the chances of all or most of that group being actual residents of Districts 22 or 32 are incredibly slim.

Similarly, immigration detention facilities also skew Louisiana’s district populations beyond those districts highlighted above. Of the 20 largest U.S. Immigration and Customs Enforcement (ICE) facilities in the country, five are in the state, leaving Louisiana residents’ access to equal representation uniquely vulnerable to the ebb and flow of federal confinement policies. The U.S. Constitution is clear: all residents — regardless of their legal status — must be counted by the Census Bureau every ten years. The question isn’t whether they should be counted but where. Most people detained in immigration facilities in Louisiana spend less than a month in that facility, so it makes no sense to count them as if they were residents of the town where the facility happens to be located on Census Day.

Simply put, being incarcerated in a specific facility doesn’t make someone a resident of the surrounding district.

Prison gerrymandering harms Louisiana’s rural residents

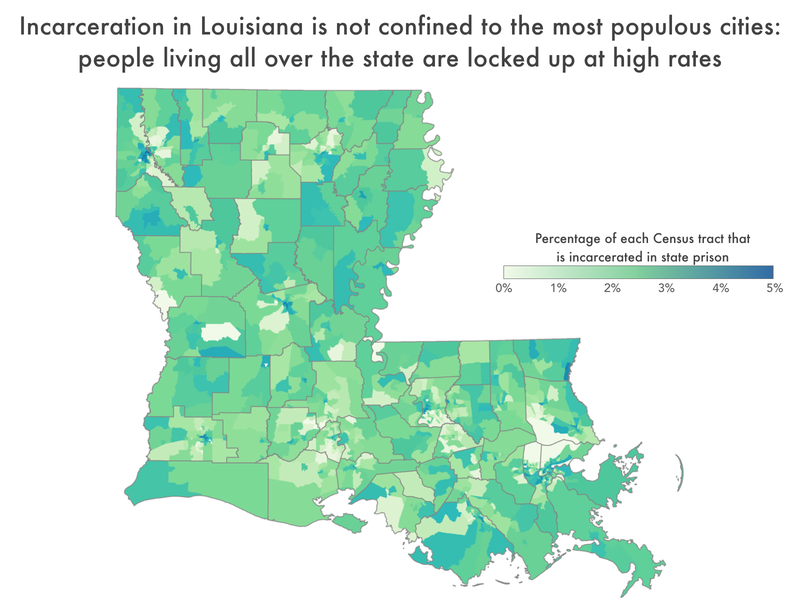
Incarcerated people come from all over Louisiana, but rural parishes have the highest incarceration rates in the state. Incarcerated people in Louisiana come from every corner of the state; every single one of the state’s 64 parishes has its residents counted as if they were residents of another parish due to the way the Census Bureau counts incarcerated people. While the largest number of incarcerated people come from the most populous parishes, on a per-capita basis, rural parishes lose the largest shares of their populations to the Bureau’s counts.

Map of Louisiana parishes showing the incarceration rate per parish This map shows the portion of each parish’s population that is missing from the parish’s Census counts due to incarceration. This map and analysis come from our Where people in prison come from: The geography of mass incarceration in Louisiana report, and details on each parish, including the raw numbers, are available in the “Parishes” appendix there.

And small cities such as Bogalusa, Ville Platte, Bastrop, and Marksville have imprisonment rates higher than New Orleans, Shreveport, and Baton Rouge, though more incarcerated people come from the larger cities.

So while a few rural communities with large prisons claim residents from other parts of the state all over the state, they are claiming residents of other rural communities too. That means that while a few rural communities benefit from counting incarcerated people as if they were local residents, on the whole, counting incarcerated people in the wrong place harms most rural communities.

Prison gerrymandering disproportionately impacts Louisiana’s Black residents

Prison gerrymandering reduces the political power of nearly all Louisiana residents by allowing a few districts with large correctional facilities to claim residents from all over the state. And while it does that, it also enshrines the racial inequities of mass incarceration into the state’s legislative districts.

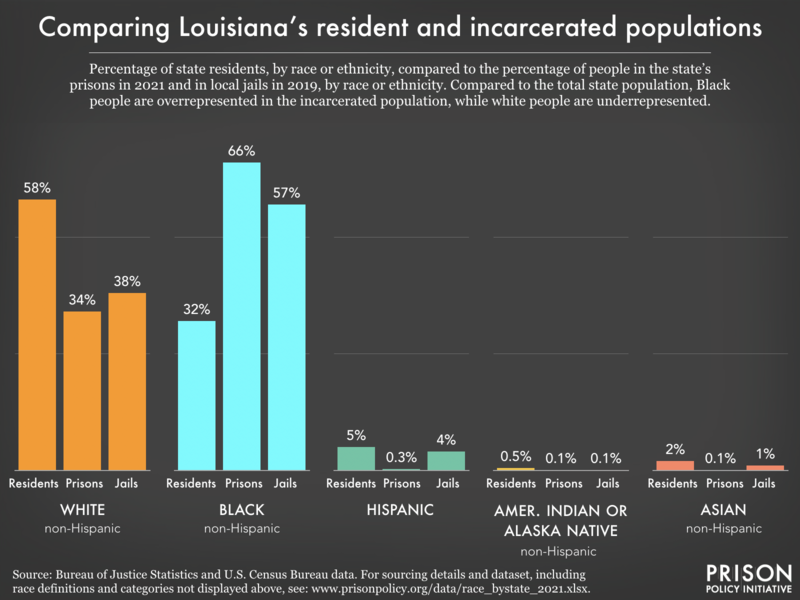
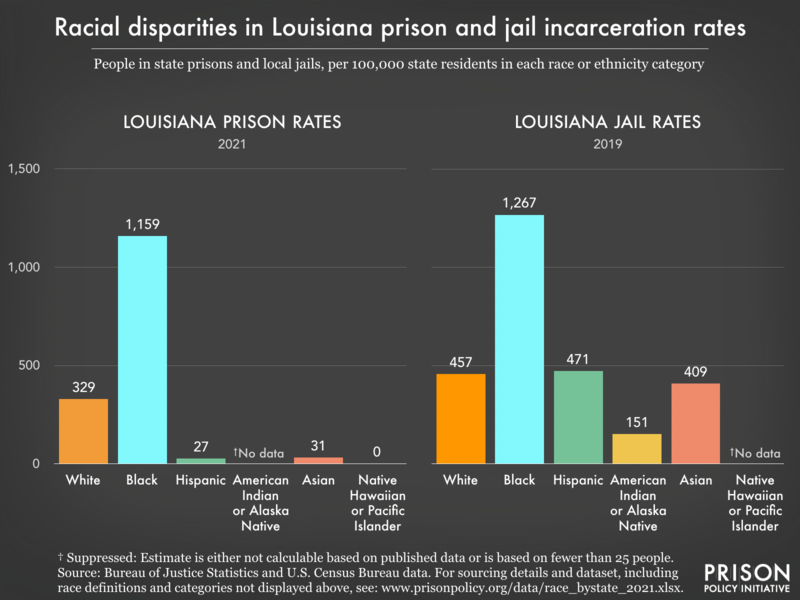
In Louisiana, like across the country, mass incarceration has a disproportionate impact along racial lines. In Louisiana, Black residents are incarcerated at disproportionate rates and therefore, counted in the wrong place more often than Louisiana’s white residents.

Graph comparing Louisiana’s resident and incarcerated populations. Showing the percentage of state residents, by race, compared to the percentage of people in the state’s prisons and jails, by race.

Black residents make up only 32% of the state population, but 66% of people in prisons and 57% of people in jails. A stark contrast to the white population, which makes up 58% of the state but only 34% of the prison population and 38% of the jail population.

Counting incarcerated people in the wrong place adds up. Just in the three districts highlighted in this report, an estimated 7,000 Black people were counted in the wrong place. This means that the Census Bureau policies are effectively silencing the voices of a large portion of the state’s Black residents.

Louisiana law says a prison cell is not a residence. Census Bureau policy disagrees

Not only does the Census Bureau’s redistricting data skew representation, it also doesn’t comply with Louisiana’s residence law. The state’s statute on voting residence — determining where someone is represented — is clear that just being present in a place doesn’t make you a resident there. It explicitly requires a person to have an intent to reside there indefinitely:

“For purposes of the laws governing voter registration and voting, ‘resident’ means a citizen who resides in this state and in the parish, municipality, if any, and precinct in which he offers to register and vote, with an intention to reside there indefinitely.”

Louisiana Annotated Revised Statutes S 18:101(B)

Instead of following state law, though, the Census Bureau follows its own “residence rule” to choose where to count incarcerated people — where they “live and sleep most of the time.” But it doesn’t even follow its own rule properly.

The Census Bureau counts incarcerated people at the location of the specific facility where they happen to be held on Census Day under the mistaken belief that is where incarcerated people “live and sleep most of the time.” The facts, however, do not support its interpretation of its own definition of residence. It is well-established that in the modern era of mass incarceration, incarcerated people do not “live and sleep most of the time” at the facility where they are held on any given day (including Census Day). Nationally, 75% of people serve time in more than one prison facility, and 12% of people serve time in at least five facilities before returning home . And, as a general rule, incarcerated people tend to return home rather than stay at the correctional facility or the surrounding community indefinitely.

Louisiana is long overdue to correct its redistricting data to match its residence law and the realities of where incarcerated people actually reside. In fact, some local governments in Louisiana have actually already started doing that on their own when drawing city or parish district lines.

Most local governments are already tackling prison gerrymandering on their own

The impact of prison gerrymandering is most clearly visible at the small scale: city and parish governments. With smaller districts at the local government level, even a single facility can have a tremendous impact on the redistricting process.

For example, in Madison Parish, there are two Police Jury Districts — Districts 2 and 3 — where incarcerated people account for 11 and 17% of the districts’ populations, respectively. District 2 contains the Louisiana Transitional Center for Women, and District 3 contains the Madison Parish Correctional and Detention Centers. That means 89 people in Policy Jury District 2, and 83 people in Police Jury District 3 have the same power as 100 people in Police Jury Districts 1, 4, and 5.

Recognizing the problems created by the Census Bureau’s data, most places in Louisiana that have significant correctional facility populations have already started taking matters into their own hands to avoid prison gerrymandering. Last decade, Allen and Catahoula Parishes drew maps where correctional facilities accounted for over half of a district’s population.2 This decade Allena and Catahoula avoided prison gerrymandering for the first time, joining 17 other Louisiana local governments that avoided prison gerrymandering in 2010: Avoyelles, Caldwell, Claiborne, Concordia, East Carroll, East Feliciana, Evangeline, Grant, Iberville, La Salle, Richland, West Carroll, West Feliciana, Winn Parishes, and Town of Amite City, and the City of Oakdale.3

In most cases, adjusting redistricting data to avoid prison gerrymandering is quite easy for local governments. The state, however, can provide a more efficient and complete solution for its local governments. Although it is not fair that Louisiana has to correct this federal issue, the state is in a better position to take on that burden than each individual city and parish.

Nationally, state and local governments are addressing the problem, but Louisiana is lagging behind

Over the course of the last few decades, over 200 local governments and a growing number of states have taken action on their own to fix this problem. Nearly half of the US population now lives in a place that corrects redistricting data they receive from the Census to avoid prison gerrymandering.

States that have ended prison gerrymandering on their own include deep “blue” states like California, “purple” states like Maine and Pennsylvania, and deep “red” states like Montana — where prison gerrymandering-reform legislation received wide bipartisan support. But Louisianans are falling behind, letting the state’s democracy continue to be skewed by an outdated federal system.

Louisiana needs to take action now

Avoiding prison gerrymandering is now well-tested with a proven track record. In fact, the bipartisan National Conference of State Legislatures called this effort “the fastest-growing trend in redistricting.“ Louisiana can now confidently pass legislation to count incarcerated people at home for redistricting purposes. The process of counting incarcerated people at home has been a success for the states that have done it. And Louisiana would have the benefit of refining its approach based on lessons learned by states that have gone through the process before. And it is easier than ever for states to act; even the Census Bureau is starting to acknowledge the problem and help.

2030 may seem far from now, but other states have learned that the earlier that reforms are put in place, the less expensive, easier to produce, and more accurate the final redistricting data becomes. Every state has a different legislative approach to ending prison gerrymandering, but as a practical matter, this model bill, prepared by a coalition of civil rights, voting rights, and criminal justice organizations, is a great place to start.4 It provides clear guidance on how this data should be collected, by whom, and how it will be used for the redistricting process.

And if Louisiana wants to avoid prison gerrymandering while redrawing its maps in response to the court order, then the state legislature can do so as part of the redistricting process — similar to the independent action by the redistricting bodies in Pennsylvania, Rhode Island, and Montana.

The one option that Louisiana does not have is waiting for the Census Bureau to solve the problem for them. The Bureau is unlikely to effect change even in time for the 2030 Census, meaning that unless Louisiana acts quickly, the state will once again be driven into prison-gerrymandering their legislative districts.

Appendix: Correctional facility populations in Louisiana State House Districts, 2020 Census

State House District Total Population Incarcerated Population Percent of the District that is Incarcerated
1 44,941 0 0.0%
2 45,642 0 0.0%
3 46,122 0 0.0%
4 46,405 1214 2.6%
5 45,375 37 0.1%
6 44,174 0 0.0%
7 43,279 89 0.2%
8 45,325 14 0.0%
9 43,401 0 0.0%
10 44,137 965 2.2%
11 42,458 1670 3.9%
12 45,889 393 0.9%
13 44,187 1821 4.1%
14 44,279 0 0.0%
15 43,934 0 0.0%
16 42,328 864 2.0%
17 42,807 2503 5.8%
18 46,494 5284 11.4%
19 43,183 859 2.0%
20 42,204 1220 2.9%
21 44,329 2733 6.2%
22 43,238 5073 11.7%
23 42,708 1708 4.0%
24 42,692 120 0.3%
25 43,136 0 0.0%
26 44,636 758 1.7%
27 44,225 0 0.0%
28 42,851 2101 4.9%
29 44,544 517 1.2%
30 42,313 248 0.6%
31 46,510 0 0.0%
32 42,409 3506 8.3%
33 44,243 0 0.0%
34 45,879 1018 2.2%
35 45,975 0 0.0%
36 45,062 0 0.0%
37 45,672 244 0.5%
38 42,309 576 1.4%
39 42,262 0 0.0%
40 45,296 277 0.6%
41 44,744 421 0.9%
42 45,662 49 0.1%
43 42,630 0 0.0%
44 42,506 1339 3.2%
45 43,372 0 0.0%
46 43,596 0 0.0%
47 46,480 24 0.1%
48 45,339 374 0.8%
49 45,670 0 0.0%
50 43,190 250 0.6%
51 46,319 407 0.9%
52 43,163 0 0.0%
53 43,160 505 1.2%
54 42,849 0 0.0%
55 45,124 168 0.4%
56 46,361 0 0.0%
57 42,697 587 1.4%
58 45,194 311 0.7%
59 45,699 0 0.0%
60 44,864 2310 5.1%
61 44,049 0 0.0%
62 42,969 1750 4.1%
63 44,638 2008 4.5%
64 45,619 0 0.0%
65 44,189 0 0.0%
66 43,703 0 0.0%
67 43,566 0 0.0%
68 44,607 0 0.0%
69 46,550 0 0.0%
70 45,398 0 0.0%
71 43,001 0 0.0%
72 42,817 940 2.2%
73 46,503 0 0.0%
74 44,185 0 0.0%
75 45,463 1454 3.2%
76 43,228 0 0.0%
77 43,291 319 0.7%
78 44,584 0 0.0%
79 45,579 0 0.0%
80 46,249 0 0.0%
81 43,632 45 0.1%
82 46,202 0 0.0%
83 43,956 0 0.0%
84 42,520 0 0.0%
85 44,303 0 0.0%
86 45,736 0 0.0%
87 45,538 930 2.0%
88 42,542 0 0.0%
89 45,218 0 0.0%
90 43,451 0 0.0%
91 42,508 0 0.0%
92 45,176 0 0.0%
93 44,224 0 0.0%
94 45,685 0 0.0%
95 43,337 541 1.2%
96 45,706 29 0.1%
97 45,713 13 0.0%
98 43,431 0 0.0%
99 45,922 0 0.0%
100 44,360 0 0.0%
101 45,346 0 0.0%
102 45,264 0 0.0%
103 43,764 155 0.4%
104 45,197 0 0.0%
105 43,366 500 1.2%

Table notes

Total Population
Total population reported for all blocks in the district (as redistricted in 2022). Block populations reported for the 2020 Census in the PL 94-171 redistricting summary files Table P1.
Incarcerated Population
Total incarcerated population reported in all blocks in the district (as redistricted in 2022), based on the incarcerated population in group quarters reported for the 2020 Census in the PL 94-171 redistricting summary files Table P5.
Percent of the District that is Incarcerated
This is the number of incarcerated people counted in the district divided by the total Census population of the district.

See the full appendix

About the Data

Correctional Facility Populations: To calculate the percentage of each district’s population that was in correctional facilities, we used the redistricting data (PL 94-171) from the 2020 Census. Table P1 provides the total population for each Census block and Table P5 provides the number of incarcerated people for each Census Block. Notably, this approach includes people in all kinds of correctional facilities, including state prisons, federal prisons, private prisons, local jails, halfway houses, etc.

Identifying specific facilities: Table P5 provides the population of correctional facilities without distinguishing between state, federal, or private facilities and it is published for each Census block. Census blocks do not necessarily translate directly to facilities, as some facilities are counted in multiple blocks and some blocks contain multiple facilities. To aid redistricting officials and advocates with using this data, the Prison Policy Initiative maintains a Facility Locator Tool that contains annotations of most of the Census blocks in the country that contain correctional facilities. These annotations rely on publicly-available data to identify facility names and types in each of these blocks.

Calculating how many Louisiana residents are held by the Bureau of Prisons:
Our calculations on the number of people in federal prisons in each state are based on data provided by the Bureau of Prisons in response to our periodic Freedom of Information Act requests. We’ve archived their response from 2020 here.

How this report quantifies prison gerrymandering compared to other analyses: There are a few ways to calculate the impact of prison gerrymandering, so other researchers may have used slightly different approaches that generate slightly different numbers for the same general problem. For example, some analyses only focus on prisons and exclude jail populations. That choice makes sense when looking at state-level policies and state districts because people in jails are very likely to also live in the legislative district where the jail is located. However, for this analysis, we included jails as well as state correctional facilities because jails in Louisiana regularly hold a significant number of people for state authorities. Still other approaches, such as that taken by the Redistricting Data Hub, are based on estimates of incarcerated people’s home addresses. That approach adds an additional level of precision for counting people held in state facilities because it seeks to not only address where these people were counted incorrectly — which accounts for the bulk of prison gerrymandering’s population distortion — but to also estimate where they should have been counted. Unfortunately, this approach isn’t able to reflect where people in federal facilities, most jails, and private facilities are from. And so, for simplicity, this report doesn’t use that approach.

Each of these approaches has its own merits, and none are universally better than others; they all highlight different aspects of how prison gerrymandering skews population numbers, and each has its own use. This complex weave of data also points to the need for the Census Bureau to count incarcerated people at home in the first place in order to provide a comprehensive solution to prison gerrymandering.

Footnotes

  1. Annotated Revised Statutes S 18:101(B)  ↩

  2. In our research conducted into the previous (2010) round of redistricting, we discovered notable prison gerrymandering in an additional 13 parishes however we did not update this research for the 2020 round of redistricting: Beauregard, Franklin, Jackson, Madison, Morehouse, Natchitoches, Orleans, Ouachita, Rapides, Union, Washington, Webster, and West Baton Rouge Parishes.

    While we do not know for sure if these local governments continue to engage in prison gerrymandering, we hope that this list will be a good starting point for other advocates or researchers who wish to look for additional examples of local governments in Louisiana that continue to engage in prison gerrymandering or that have decided they no longer wish to engage in the practice.
     ↩

  3. Nationwide we identified hundreds of governments that avoided prison gerrymandering after the 2000 and 2010 Censuses (decades when zero and two, respectively, states adjusted their redistricting data to count people at home). This decade we limited the scope of our research but still found an additional 21 local governments scattered across 10 states that started doing so after the 2020 Census despite those states continuing to use unadjusted data for state-level districts. Louisiana is one of those states. Allen and Catahoula Parishes avoided prison gerrymandering for the first time in the 2020 redistricting cycle.
     ↩

  4. When choosing how to adapt the model legislation to Louisiana’s needs, the state should consider its use of private prisons, its reliance on local jails for state-level incarceration, as well as the presence of federal facilities. Past bills, such as HB265, introduced in the 2020 session, that are based on the model bill may also offer a good place to start.
     ↩


North Carolina’s redistricting data was once again skewed after the 2020 Census; the state needs to take action to fix the issue for 2030.

by Aleks Kajstura, May 13, 2025

Everyone in North Carolina is supposed to have an equal voice in their government’s decisions, but an outdated and misguided Census Bureau policy that counts incarcerated people in the wrong place gives a few residents of the state a megaphone. It is a problem known as prison gerrymandering, and North Carolina lawmakers can fix it.

North Carolina blindly follows outdated bureaucratic federal policy

Every ten years, when the Census Bureau conducts its official tally of the nation’s population, it incorrectly counts incarcerated people as residents of prison cells rather than in their home communities. This is despite the fact that they usually are not from the prison town, have no family or social ties there, likely won’t stay there for long, and state residence law1 says they’re not residents there. When state officials then use that incorrect Census data in the legislative redistricting process, they inadvertently inflate the populations of those areas — in violation of constitutional principles of equal representation. This gives residents of state legislative districts that contain correctional facilities a particularly loud voice in government, allowing them to have an outsized influence on debates about funding childcare centers, determining pollution liability, streamlining road maintenance, permit requirements for carrying guns, and more, at the expense of nearly every other person in the state.

That is why states across the country have taken steps to fix the problem that the Census Bureau created. But, North Carolina is one of the remaining states still suffering from this “prison gerrymandering.” While the 2030 Census count is still years away, North Carolina needs to act now to avoid prison gerrymandering the next time it redraws its districts.

Prison gerrymandering significantly distorts North Carolina’s state legislative districts

In North Carolina, there are three State House districts that powerfully illustrate how prisons distort district populations and give some residents a louder voice in government as a result of prison gerrymandering.

In these three State House districts — districts 12, 32, and 38 — correctional facilities account for roughly 4% of the population. That means that just 96 residents of those districts have as much political clout as 100 residents in any other district. That imbalance in representation comes from the state choosing to redistrict based on Census numbers that don’t match the reality of where people live.

Three most prison-gerrymandered State House Districts in North Carolina:

These three districts are the most prison-gerrymandered in North Carolina. For details on all districts, see the Appendix
State House District District Location Facilities in the district include Percent of the district that is incarcerated
District 12 Greene, Jones, Lenoir Counties Eastern Correctional Institution, Greene Correctional Institution, Maury Correctional Institution 3.8%
District 38 Part of Wake County N.C. Correctional Institution for Women, Wake Correctional Center, Wake County Detention Annex, Caval Corp Community Sanction Center, Wake County Jail 3.7%
District 32 Granville and part of Vance Counties FCI Butner (part), Polk Correctional Institution 3.7%

These three districts showcase the various ways that correctional facilities contribute to prison gerrymandering. All three districts have roughly the same level of prison gerrymandering, but the types of correctional facilities in each vary:

  • District 12 contains state facilities run by the North Carolina Department of Adult Correction Facilities, which means that people incarcerated there live all over the state.
  • District 38 contains state facilities as well as a county jail. While it is true that most people in county jails come from the county where the jail is located, in this instance, the people confined there are still likely counted in the wrong legislative district. That’s because the county is split among 13 State House districts.
  • District 32 contains a federal correctional facility run by the Federal Bureau of Prisons, which means that people there come from all over the U.S. Only about 4% of people incarcerated by the Bureau of Prisons are North Carolina residents, meaning that of the 2,023 people counted at the Butner facility that were allocated to this district, only 81 are likely North Carolina residents, and the chances of all or most of that group being actual residents of District 32 are incredibly slim.

Correctional agencies regularly move thousands of people in, out, and across the state. Distributing political power based on where incarcerated people happen to be held on Census Day makes no sense.

Prison gerrymandering disproportionately harms North Carolinians living in rural areas

Based on our analysis of Department of Adult Correction records, incarcerated people in North Carolina come disproportionately from rural areas. Rural counties account for 35% of the state’s population, but 40% of people incarcerated in North Carolina come from rural counties. Prison gerrymandering shifts populations away from most rural communities in the state and concentrates power in the few areas that have amassed the largest prisons.

Graph comparing North Carolina's rural county population and incarcerated population from rural counties.

Also, contrary to common assumption, prison gerrymandering has no partisan benefit in North Carolina. A partisan analysis of prison gerrymandering published by the Redistricting Data Hub found that prison gerrymandering has an equal impact on Republican and Democratic districts.

Prison gerrymandering disproportionately harms Black and Native American North Carolinians

Prison gerrymandering reduces the political power of nearly all North Carolina residents by allowing a few districts with large correctional facilities to claim residents from all over the state. And while it does that, it also enshrines the racial inequities of mass incarceration into the state’s legislative districts.

In North Carolina, like across the country, mass incarceration has a disproportionate impact along racial lines. In North Carolina, Black residents are incarcerated at disproportionate rates and, therefore counted in the wrong place more often than North Carolina’s white residents.

Graph comparing North Carolina's resident and incarcerated populations. Showing the percentage of state residents, by race, compared to the percentage of people in the state's prisons and jails, by race.

Black residents make up 21% of the state population, but a whopping 50% of people in prisons and 47% of people in jails.

Native American residents are also disproportionately impacted, making up just 1% of the state population but 2% of people in prisons and 1.3% of people in jails. That means they are incarcerated at roughly twice the rate you would expect based on their population.

Both are a stark contrast to the white population, which makes up 62% of the state but only 41% of the prison population and 47% of the jail population.

Counting incarcerated people in the wrong place adds up. Just in the three districts highlighted above, nearly 4,500 Black people were counted in the wrong place. This means that the Census Bureau policies are effectively silencing the voices of a large portion of the state’s Black residents.

North Carolina law says a prison cell is not a residence. Census Bureau policy disagrees

Not only does the Census Bureau’s redistricting data cause prison gerrymandering, it also doesn’t comply with North Carolina’s law. The state’s residence statute explicitly states that incarceration doesn’t change a person’s residence. They do not lose residence at their home address, and they do not gain residence at the correctional facility where they are held:

A person shall not be considered to have lost that person’s residence if that person leaves home… with the intention of returning

“A person shall not be considered to have gained a residence … without the intention of making that county, municipality, precinct, ward, or other election district a permanent place of abode.

N.C. Gen. Stat. S 163-57(2) and (3)

Instead of following state law, though, the Census Bureau follows its own “residence rule” to choose where to count incarcerated people — where they “live and sleep most of the time.” But it doesn’t even follow this rule properly.

The Census Bureau counts incarcerated people at the location of the facility where they happen to be held on Census Day under the mistaken belief that is where incarcerated people “live and sleep most of the time.” The facts, however, do not support its interpretation of its own definition of residence. It is well-established that in the modern era of mass incarceration, incarcerated people do not “live and sleep most of the time” at the facility where they are held on any given day (including Census Day). Nationally, 75% of people serve time in more than one prison facility, and 12% of people serve time in at least five facilities before returning home.

North Carolina is long overdue to correct its redistricting data to match its residence law and the realities of where incarcerated people actually reside. In fact, some local governments in North Carolina have already started doing that on their own when drawing city or county district lines.

Some local governments are already tackling prison gerrymandering on their own

The impact of prison gerrymandering is most clearly visible at the small scale: city and county governments. With smaller districts at the city or county level, even a single facility can have a tremendous impact on the redistricting process.

For example, in the City of Lumberton, there is a City Council district where incarcerated people account for 47% of the district’s population. The district contains the Lumberton Correctional Institution and Robeson County Jail. The result is that 53 people in that district have the same power as 100 people in the other two commissioner districts.2

Additionally, what the city may not have realized when it relied on the Census Bureau’s redistricting data, is that the jail, which actually sits outside of city limits, was counted in the wrong spot — as if it were part of the state facility next door (the state facility is actually within the city’s boundary). These sorts of errors are a common feature of the Census Bureau’s correctional facility counts, and that makes relying on the Census Bureau’s prison counts even more problematic.

Facing these absurd outcomes, some of North Carolina’s local governments have already started taking matters into their own hands and rejecting the Bureau’s way of counting incarcerated people. In the two latest redistricting cycles, at least three local governments in North Carolina have avoided prison gerrymandering to ensure their residents have equal representation in local government: Caswell, Columbus, and Granville Counties.3

In most cases, adjusting redistricting data to avoid prison gerrymandering is quite easy for local governments. However, the state can provide a more efficient and complete solution for its local governments. Although it is not fair that the state has to correct for this federal issue, the state is in a better position to take on that burden than each individual city and county.

Nationally, state and local governments are addressing the problem, but North Carolina is lagging behind

Over the course of the last few decades, over 200 local governments and a growing number of states, have taken action on their own to fix this problem. Nearly half of the US population now lives in a place that corrects redistricting data they receive from the Census to avoid prison gerrymandering.

States that have ended prison gerrymandering on their own include deep “blue” states like California, “purple” states like Maine and Pennsylvania, and deep “red” states like Montana — where prison gerrymandering-reform legislation received wide bipartisan support. But North Carolinians are falling behind, letting the state’s democracy continue to be skewed by an outdated federal system.

North Carolina needs to take action now

Avoiding prison gerrymandering is now well-tested with a proven track record. In fact, the bipartisan National Conference of State Legislatures called this effort “the fastest-growing trend in redistricting.” North Carolina can now confidently pass legislation to count incarcerated people at home for redistricting purposes. Other states have already been successful in these efforts, paving the way for North Carolina. And the state would have the benefit of refining its approach based on lessons learned by states that have gone through the process before. And it is easier than ever for states to act; even the Census Bureau is starting to acknowledge the problem and help.

2030 may seem far away but other states have learned that the earlier that reforms are put in place, the less expensive, easier to produce, and more accurate the final redistricting data becomes. Every state has a different legislative approach to ending prison gerrymandering, but as a practical matter, this model bill, prepared by a coalition of civil rights, voting rights, and criminal justice organizations, is a great place to start. It provides clear guidance on how this data should be collected, by whom, and how it will be used for the redistricting process.

The Census Bureau is unlikely to change its policies about how to count incarcerated people in time for the 2030 Census, meaning that unless North Carolina acts quickly, the state will once again be driven into prison-gerrymandering their legislative districts.

North Carolina needs to end prison gerrymandering now.

Appendix: Correctional facility populations in North Carolina State House Districts, 2020 Census

State House District Total Population Incarcerated Population Percent of the District that is Incarcerated
1 82812 63 0.1%
2 90751 2511 2.8%
3 84906 818 1.0%
4 83034 0 0.0%
5 82953 2306 2.8%
6 90919 966 1.1%
7 83541 764 0.9%
8 83559 357 0.4%
9 86684 0 0.0%
10 83014 1388 1.7%
11 86381 0 0.0%
12 84745 3229 3.8%
13 83500 424 0.5%
14 88470 237 0.3%
15 91212 0 0.0%
16 85097 742 0.9%
17 90514 0 0.0%
18 89413 0 0.0%
19 91288 241 0.3%
20 91180 597 0.7%
21 87764 0 0.0%
22 88642 694 0.8%
23 88865 1491 1.7%
24 83322 154 0.2%
25 90432 770 0.9%
26 89947 0 0.0%
27 84735 1658 2.0%
28 85389 865 1.0%
29 90900 0 0.0%
30 91038 14 0.0%
31 91241 277 0.3%
32 88602 3235 3.7%
33 85001 17 0.0%
34 89807 0 0.0%
35 83094 0 0.0%
36 86038 0 0.0%
37 90307 0 0.0%
38 86444 3190 3.7%
39 85371 0 0.0%
40 86359 0 0.0%
41 89876 0 0.0%
42 82965 0 0.0%
43 85335 0 0.0%
44 82683 535 0.6%
45 83745 0 0.0%
46 83701 2187 2.6%
47 83452 1060 1.3%
48 86256 2755 3.2%
49 84251 825 1.0%
50 86290 1539 1.8%
51 83073 416 0.5%
52 84383 716 0.8%
53 83312 0 0.0%
54 83475 66 0.1%
55 82927 1598 1.9%
56 85142 0 0.0%
57 90259 0 0.0%
58 90051 0 0.0%
59 90829 0 0.0%
60 90340 238 0.3%
61 90183 654 0.7%
62 89637 0 0.0%
63 83847 0 0.0%
64 87568 397 0.5%
65 91096 173 0.2%
66 88717 0 0.0%
67 88255 1329 1.5%
68 88209 0 0.0%
69 89186 0 0.0%
70 89118 448 0.5%
71 88823 0 0.0%
72 84444 913 1.1%
73 90036 555 0.6%
74 83545 0 0.0%
75 87378 0 0.0%
76 89815 1174 1.3%
77 90628 136 0.2%
78 86365 0 0.0%
79 84681 1219 1.4%
80 83289 0 0.0%
81 85641 647 0.8%
82 91227 0 0.0%
83 90899 0 0.0%
84 86773 324 0.4%
85 90770 2791 3.1%
86 87570 1145 1.3%
87 85009 413 0.5%
88 84505 0 0.0%
89 85577 443 0.5%
90 88208 150 0.2%
91 82920 103 0.1%
92 87079 10 0.0%
93 87194 225 0.3%
94 85564 1690 2.0%
95 85366 0 0.0%
96 89587 0 0.0%
97 86810 218 0.3%
98 82789 0 0.0%
99 84406 30 0.0%
100 86763 0 0.0%
101 84368 0 0.0%
102 84206 90 0.1%
103 89354 0 0.0%
104 83554 0 0.0%
105 85671 0 0.0%
106 86716 1454 1.7%
107 88854 0 0.0%
108 89468 686 0.8%
109 88881 0 0.0%
110 89459 255 0.3%
111 84508 0 0.0%
112 87217 0 0.0%
113 89151 510 0.6%
114 91120 365 0.4%
115 88875 656 0.7%
116 89457 369 0.4%
117 91035 155 0.2%
118 83282 86 0.1%
119 90212 125 0.1%
120 84907 218 0.3%

Table notes

Total Population
Total population reported for all blocks in the district (as redrawn in 2023). Block populations reported for the 2020 Census in the PL 94-171 redistricting summary files Table P1.
Incarcerated Population
Total incarcerated population reported in all blocks in the district (as redrawn in 2023), based on the incarcerated population in group quarters reported for the 2020 Census in the PL 94-171 redistricting summary files Table P5
Percent of the District that is Incarcerated
This is the number of incarcerated people counted in the district divided by the total Census population of the district.

See the full appendix

About the Data

Correctional Facility Populations: To calculate the percentage of each district’s population that was in correctional facilities, we used the redistricting data (PL 94-171) from the 2020 Census. Table P1 provides the total population for each Census block and Table P5 provides the number of incarcerated people for each Census Block. Notably, this approach includes people in all kinds of correctional facilities, including state prisons, federal prisons, private prisons, local jails, halfway houses, etc.

Identifying specific facilities: Table P5 provides the population of correctional facilities without distinguishing between state, federal, or private facilities and it is published for each Census block. Census blocks do not necessarily translate directly to facilities, as some facilities are counted in multiple blocks and some blocks contain multiple facilities. To aid redistricting officials and advocates with using this data, the Prison Policy Initiative maintains a Facility Locator Tool that contains annotations of most of the Census blocks in the country that contain correctional facilities. These annotations rely on publicly-available data to identify facility names and types in each of these blocks.

Calculating how many North Carolina residents are held by the Bureau of Prisons:
Our calculations on the number of people in federal prisons in each state are based on data provided by the Bureau of Prisons in response to our periodic Freedom of Information Act requests. We’ve archived their response from 2020 at: https://www.prisonpolicy.org/scans/2020-bop-origin.pdf

How this report quantifies prison gerrymandering compared to other analyses: There are a few ways to calculate the impact of prison gerrymandering, so other researchers may have used slightly different approaches that generate slightly different numbers for the same general problem. For example, some analyses only focus on prisons and exclude jail populations. That choice makes sense when looking at state-level policies and state districts because people in jails are very likely to also live in the legislative district where the jail is located. However, for this analysis we included jails as well as state correctional facilities because Oklahoma regularly rents space in local jails to hold a significant number of people for state authorities. Still other approaches, such as that taken by the Redistricting Data Hub, are based on estimates of incarcerated people’s home addresses. That approach adds an additional level of precision for counting people held in state facilities because it seeks to not only address where these people were counted incorrectly — which accounts for the bulk of prison gerrymandering’s population distortion, — but to also estimate where they should have been counted. Unfortunately, this approach isn’t able to reflect where people in federal facilities, and most jails and private facilities are from. And so for simplicity this report doesn’t use that approach.

Each of these approaches have their own merits, and none are universally better than others; they all highlight different aspects of how prison gerrymandering skews population numbers, and each have their own use. This complex weave of data also points to the need for the Census Bureau to count incarcerated people at home in the first place in order to provide a comprehensive solution to prison gerrymandering.

Analysis of rural impact: We followed the NC Rural Center’s determinations in identifying rural counties. And we used the ASQ (Automated System Query) tool, available through the Administrative Analysis Section of the NC Department of Adult Correction to determine the home counties of incarcerated people.

Footnotes

  1. N.C. Gen. Stat. S 163-57(2) and (3)  ↩

  2. In our research conducted into the previous (2010) round of redistricting, we discovered notable prison gerrymandering in an additional 15 counties, cities, and school boards but where we did not have the resources to update our research for the 2020 round of redistricting: Anson County, Anson County Schools, Caswell County Schools, Clinton city, Edgecombe County, Franklin County, Franklin County Schools, Goldsboro city, Granville County Schools, Halifax County, Lumberton city, Pamlico County, Pamlico County Schools, Pasquotank County, and Robeson County.

    While we do not know for sure if these local governments continue to engage in prison gerrymandering, we hope that this list will be a good starting point for other advocates or researchers who wish to look for additional examples of local governments in North Carolina that continue to engage in prison gerrymandering or that have decided they no longer wish to engage in the practice.  ↩

  3. Nationwide we identified hundreds of governments that avoided prison gerrymandering after the 2000 and 2010 Censuses (decades when zero and two, respectively, states adjusted their redistricting data to count people at home). This decade we limited the scope of our research but still found an additional 21 local governments scattered across 10 states that started doing so after the 2020 Census despite those states continuing to use unadjusted data for state-level districts. North Carolina is one of those states; Granville County avoided prison gerrymandering for the first time in the 2020 redistricting cycle.  ↩


Oklahoma’s redistricting data once again skewed after the 2020 Census; the state needs to take action to fix the issue for 2030

by Aleks Kajstura, April 29, 2025

Everyone in Oklahoma is supposed to have an equal voice in their government’s decisions, but an outdated and misguided Census Bureau policy that counts incarcerated people in the wrong place gives a few residents of the state a megaphone. It is a problem known as prison gerrymandering, and Oklahoma lawmakers can fix it.

Oklahoma blindly follows an outdated bureaucratic federal policy

Every ten years, when the Census Bureau conducts its official tally of the nation’s population, it incorrectly counts incarcerated people as residents of prison cells rather than in their home communities. This is despite the fact that they usually are not from the prison town, have no family or social ties there, and likely won’t stay there for long. When state officials then use that incorrect Census data in the legislative redistricting process, they inadvertently inflate the populations of those areas — in violation of constitutional principles of equal representation. This gives residents of some state legislative districts that contain correctional facilities a particularly loud voice in government, allowing them to have an outsized influence on debates about taxation, school funding, health insurance, and more, at the expense of nearly every other person in the state.

That is why states across the country have taken steps to fix the problem that the Census Bureau created. But, Oklahoma is one of the remaining states still suffering from this “prison gerrymandering.” In fact, Oklahoma is home to the 5th most prison-gerrymandered state legislative district in the country. While the 2030 Census count is still years away, Oklahoma needs to act now to avoid prison gerrymandering the next time it redraws its districts.

Prison gerrymandering significantly distorts Oklahoma’s state legislative districts

In Oklahoma, there are three state House districts — districts 56, 18, and 63 — that powerfully illustrate how prisons distort district populations and give some residents a louder voice in government as a result of prison gerrymandering.

In District 56, for example, correctional facilities make up 14% of the population. That means that just 86 residents of that district have as much political clout as 100 residents in any other district. That imbalance in representation comes from the state choosing to redistrict based on Census numbers that don’t match the reality of where people live.

Census counts place incarcerated people in the wrong districts

These three districts are the most prison-gerrymandered in Oklahoma. For details on all districts, see the Appendix
State House District District Location Facilities in the district include Percent of the district that is incarcerated
District 56 Caddo, Canadian, Grady Counties Great Plains Correctional Facility, El Reno FCI and Camp 14.0%
District 18 Coal, Hughes, Okfuskee, Pittsburg Counties Davis Correctional Facility and Work Center, John Lilley Correctional Center, Jackie Brannon Correctional Center, Oklahoma State Penitentiary 10.1%
District 63 Comanche, Cotton, Kiowa, Tillman Counties Lawton Correctional Facility 6.6%

These three districts are the most prison-gerrymandered state legislative districts in Oklahoma. Large chunks of their population are made up of prisons that contain people from other parts of the state, instead of local residents.

In fact, the largest facilities in District 56 don’t even contain Oklahoma residents — they are used by the federal Bureau of Prisons to hold people from all over the country. Only about 1% of the Bureau of Prisons population comes from Oklahoma, which means out of the thousands of people held by the Bureau of Prisons in that district, only about 45 people are likely Oklahoma residents. And the chances of all or most of that group being actual residents of District 56 are incredibly slim.

It may be obvious that residents of other states shouldn’t be counted as part of a district’s population, but state facilities regularly have people who are from Oklahoma and are incarcerated far from home, have no ties to the communities where the facilities are located, and are moved regularly between facilities for administrative convenience. Simply put, being incarcerated in a specific facility doesn’t make someone a resident of the surrounding district.

Unlike actual resident populations, the facility populations counted by the Census can shift suddenly, independent of the surrounding community. For example, since the Census was taken in 2020, the Great Plains facility in District 56 was closed, then reopened, and is once again on the verge of closure.

Not only were people incarcerated in District 56 not residents of the district at the time of the Census, but a majority of them were moved when the Bureau of Prisons ended its contract with the company that owns the Great Plains facility. So the prison sat empty until the Oklahoma Department of Corrections leased the facility and filled it once again with people. The yo-yo-ing of the population in and out of the facility is set to continue as the state is starting to sour on that plan as well, likely leading to another arbitrary population change. Similarly, the 2,500 population of Lawton Correctional Facility in District 63 was subject to similar uncertainty last year. Decisions about whether to keep a prison open or not shouldn’t change how power is distributed in state government, but because of prison gerrymandering, they do.

Correctional agencies regularly move thousands of people in, out, and across the state. Distributing political power based on where incarcerated people happen to be held on Census Day makes no sense.

Prison gerrymandering disproportionately impacts Black and Native American Oklahomans

Prison gerrymandering reduces the political power of nearly all Oklahoma residents by allowing a few districts with large correctional facilities to claim residents from all over the state. And while it does that, it also enshrines the racial inequities of mass incarceration into the state’s democratic institutions.

In Oklahoma, like across the country, mass incarceration has a disproportionate impact along racial lines. Black and Native American residents are incarcerated at disproportionate rates and therefore counted in the wrong place more often than Oklahoma’s white residents.

Graph comparing Oklahoma's resident and incarcerated populations. Showing the percentage of state residents, by race, compared to the percentage of people in the state's prisons and jails, by race.

Black residents make up only 7% of the state population but 27% of people in prisons and 23% of people in jails. Native American residents also make up 7% of the state population but 9% of people in prisons and 12% of people in jails. A stark contrast to the white population, which makes up 64% of the state but only 50 and 55% of the prison and jail population, respectively.

The racial impact of prison gerrymandering is so strong that, for example, nearly half of the Black people counted in District 18 were actually behind bars, rather than living in the community. Looking at the demographic breakdown of districts like this reinforces the fact that prison-gerrymandered districts are not representative of the actual local resident population.

Local governments are already tackling prison gerrymandering on their own

The impact of prison gerrymandering is most clearly visible at the small scale: city and county governments. With smaller districts at the city or county level, even a single facility can have a tremendous impact on the redistricting process.

For example, in Caddo County, there is a County Commissioner District where incarcerated people account for 37% of the district’s population. The district contains the Great Plains Correction Facility. The result is that 63 people in that commissioner district had the same power as 100 people in the other two commissioner districts.

Caddo County isn’t alone. We found six other counties that continue to distort their residents’ local representation by using Census Bureau’s data that counts correctional facilities as if they were local residents: Beckham, Craig, Hughes, Muskogee, Okfuskee, and Pittsburg Counties.1

Recognizing the population problems created by the Census Bureau’s data, some of Oklahoma’s local governments have already started taking matters into their own hands to avoid prison gerrymandering. We found six local governments that used a variety of methods to ensure their residents have an equal representation in local government: Alfalfa, Akota, Greer, Wood, and Woodward Counties, as well as the City of McAlester.2

In most cases, adjusting redistricting data to avoid prison gerrymandering is quite easy for local governments. But the experience of McAlester shows that even with the best intentions, governments can fall victim to prison gerrymandering.

The City of McAlester used to exclude prison populations when redistricting, but a mid-decade charter revision unintentionally required the city to include the prison population when the 2010 round of redistricting rolled around. The new charter language pegged McAlester’s redistricting data to the Census, which, of course, tabulated people incarcerated at the two state correctional facilities in town as if they were actual residents of McAlester. This resulted in the city drawing a district where prisons accounted for 60% of the population. Then, finally, the city amended its charter once more in 2015 (after over a year of trying) to end prison gerrymandering for good.

The state can provide a more efficient and complete solution for its local governments. Although it is not fair that the state has to correct for this federal issue, the state is in a better position to take on that burden than each individual city and county.

Nationally, state and local governments are addressing the problem, but Oklahoma is lagging behind

Over the course of the last few decades, over 200 local governments and a growing number of states have taken action on their own to fix this problem. Nearly half of the US population now lives in a place that corrects redistricting data they receive from the Census to avoid prison gerrymandering.

States that have ended prison gerrymandering on their own include deep “blue” states like California, “purple” states like Maine and Pennsylvania, and deep “red” states like Montana — where prison gerrymandering-reform legislation received wide bipartisan support. But Oklahomans are falling behind, letting the state’s democracy continue to be skewed by an outdated federal system.

Oklahoma needs to take action now

Avoiding prison gerrymandering is now well-tested with a proven track record. In fact, the bipartisan National Conference of State Legislatures called this effort “the fastest-growing trend in redistricting.“ Oklahoma can now confidently pass legislation to count incarcerated people at home for redistricting purposes. The process of counting incarcerated people at home has been a success for the states that have done it. And Oklahoma would have the benefit of refining its approach based on lessons learned by states that have gone through the process before. And it is easier than ever for states to act; even the Census Bureau is starting to acknowledge the problem and help.

2030 may seem far from now, but other states have learned that the earlier that reforms are put in place, the less expensive, easier to produce, and more accurate the final redistricting data becomes. Every state has a different legislative approach to ending prison gerrymandering, but as a practical matter, this model bill, prepared by a coalition of civil rights, voting rights, and criminal justice organizations, is a great place to start.3 It provides clear guidance on how this data should be collected, by whom, and how it will be used for the redistricting process.

The Census Bureau is unlikely to effect change in time for the 2030 Census, meaning that unless states act quickly, they will once again be driven into prison-gerrymandering their legislative districts. Oklahoma needs to end prison gerrymandering now.

Appendix: Correctional facility populations in Oklahoma State House Districts, 2020 Census

State House District Total Population Incarcerated Population Percent of the District that is Incarcerated
1 38,865 957 2.5%
2 39,281 64 0.2%
3 38,945 150 0.4%
4 39,415 90 0.2%
5 38,785 44 0.1%
6 38,889 497 1.3%
7 38,785 12 0.0%
8 38,760 79 0.2%
9 38,924 216 0.6%
10 39,562 130 0.3%
11 39,453 0 0.0%
12 38,441 0 0.0%
13 38,980 1,945 5.0%
14 38,618 297 0.8%
15 38,469 69 0.2%
16 38,668 351 0.9%
17 38,420 22 0.1%
18 38,438 3,896 10.1%
19 38,433 734 1.9%
20 38,918 2,373 6.1%
21 38,420 77 0.2%
22 39,092 929 2.4%
23 38,981 0 0.0%
24 38,814 0 0.0%
25 39,307 51 0.1%
26 38,973 246 0.6%
27 39,484 0 0.0%
28 39,344 1,277 3.2%
29 39,200 0 0.0%
30 38,434 188 0.5%
31 39,871 0 0.0%
32 38,442 70 0.2%
33 39,799 1,562 3.9%
34 39,198 177 0.5%
35 38,438 48 0.1%
36 38,603 0 0.0%
37 39,314 1,288 3.3%
38 39,987 285 0.7%
39 39,851 0 0.0%
40 39,258 250 0.6%
41 39,371 0 0.0%
42 38,643 82 0.2%
43 39,100 0 0.0%
44 39,842 0 0.0%
45 39,613 0 0.0%
46 39,590 232 0.6%
47 38,562 0 0.0%
48 39,007 24 0.1%
49 38,523 82 0.2%
50 38,435 175 0.5%
51 38,848 0 0.0%
52 39,144 876 2.2%
53 39,650 0 0.0%
54 40,018 0 0.0%
55 39,554 157 0.4%
56 38,644 5,398 14.0%
57 39,522 2,299 5.8%
58 39,162 1,724 4.4%
59 38,885 123 0.3%
60 38,790 0 0.0%
61 38,526 964 2.5%
62 38,853 0 0.0%
63 38,509 2,547 6.6%
64 38,977 484 1.2%
65 39,270 81 0.2%
66 39,775 0 0.0%
67 39,317 0 0.0%
68 38,486 0 0.0%
69 38,901 0 0.0%
70 38,836 0 0.0%
71 39,548 0 0.0%
72 39,602 0 0.0%
73 38,917 1,177 3.0%
74 39,980 0 0.0%
75 39,446 0 0.0%
76 39,039 0 0.0%
77 39,145 0 0.0%
78 39,945 0 0.0%
79 39,750 0 0.0%
80 39,625 0 0.0%
81 39,143 1 0.0%
82 39,875 0 0.0%
83 39,885 0 0.0%
84 39,605 0 0.0%
85 39,830 0 0.0%
86 38,458 34 0.1%
87 39,914 0 0.0%
88 39,584 20 0.1%
89 39,776 146 0.4%
90 38,917 1,225 3.1%
91 39,748 0 0.0%
92 39,950 1,440 3.6%
93 39,752 0 0.0%
94 39,784 0 0.0%
95 39,967 18 0.0%
96 39,716 0 0.0%
97 39,557 519 1.3%
98 39,615 0 0.0%
99 39,829 253 0.6%
100 39,880 0 0.0%
101 39,359 0 0.0%

Table notes

Total Population
Total population reported for all blocks in the district (as redistricted in 2021). Block populations reported for the 2020 Census in the PL 94-171 redistricting summary files Table P1.
Incarcerated Population
Total incarcerated population reported in all blocks in the district (as redistricted in 2021), based on the incarcerated population in group quarters reported for the 2020 Census in the PL 94-171 redistricting summary files Table P5.

Percent of the District that is Incarcerated
This is the number of incarcerated people counted in the district divided by the total population of the district.

See the full appendix

About the Data

Correctional Facility Populations: To calculate the percentage of each district’s population that was in correctional facilities, we used the redistricting data (PL 94-171) from the 2020 Census. Table P1 provides the total population for each Census block and Table P5 provides the number of incarcerated people for each Census Block. Notably, this approach includes people in all kinds of correctional facilities, including state prisons, federal prisons, private prisons, local jails, halfway houses, etc.

Identifying specific facilities: Table P5 provides the population of correctional facilities without distinguishing between state, federal, or private facilities and it is published for each Census block. Census blocks do not necessarily translate directly to facilities, as some facilities are counted in multiple blocks and some blocks contain multiple facilities. To aid redistricting officials and advocates with using this data, the Prison Policy Initiative maintains a Facility Locator Tool that contains annotations of most of the Census blocks in the country that contain correctional facilities. These annotations rely on publicly-available data to identify facility names and types in each of these blocks.

Calculating how many Oklahoma residents are held by the Bureau of Prisons:
Our calculations on the number of people in federal prisons in each state are based on data provided by the Bureau of Prisons in response to our periodic Freedom of Information Act requests. We’ve archived their response from 2020 at: https://www.prisonpolicy.org/scans/2020-bop-origin.pdf

How this report quantifies prison gerrymandering compared to other analyses: There are a few ways to calculate the impact of prison gerrymandering, so other researchers may have used slightly different approaches that generate slightly different numbers for the same general problem. For example, some analyses only focus on prisons and exclude jail populations. That choice makes sense when looking at state-level policies and state districts because people in jails are very likely to also live in the legislative district where the jail is located. However, for this analysis we included jails as well as state correctional facilities because Oklahoma regularly rents space in local jails to hold a significant number of people for state authorities. Still other approaches, such as that taken by the Redistricting Data Hub, are based on estimates of incarcerated people’s home addresses. That approach adds an additional level of precision for counting people held in state facilities because it seeks to not only address where these people were counted incorrectly — which accounts for the bulk of prison gerrymandering’s population distortion — but to also estimate where they should have been counted. Unfortunately, this approach isn’t able to reflect where people in federal facilities, and most jails and private facilities are from. And so for simplicity this report doesn’t use that approach.

Each of these approaches have their own merits, and none are universally better than others; they all highlight different aspects of how prison gerrymandering skews population numbers, and each have their own use. This complex weave of data also points to the need for the Census Bureau to count incarcerated people at home in the first place in order to provide a comprehensive solution to prison gerrymandering.

Footnotes

  1. There are likely to be additional counties and cities in Oklahoma that continue to suffer from prison gerrymandering after 2020 round of districting. We know of 16 counties and 2 cities (Caddo, Canadian, Cleveland, Comanche, Grady, Harmon, Jackson, Jefferson, Kiowa, Le Flore, Oklahoma, Osage, Payne, Pottawatomie, Tillman, Tulsa counties, and the cities of Chickasha and El Reno) that engaged in prison gerrymandering in past cycles, although we have not yet confirmed that they continued to do so in the 2020 cycle. These counties and cities would be a good place for other researchers to start.  ↩

  2. Nationwide we identified hundreds of governments that avoided prison gerrymandering after the 2000 and 2010 Censuses (decades when zero and two, respectively, states adjusted their redistricting data to count people at home). This decade we limited the scope of our research but still found an additional 21 local governments scattered across 10 states that started doing so after the 2020 Census despite those states continuing to use unadjusted data for state-level districts. Oklahoma is one of those states. Atoka and Woodward Counties avoided prison gerrymandering for the first time in the 2020 redistricting cycle.  ↩

  3. When choosing how to adapt the model legislation to Oklahoma’s needs, the state should consider its use of private prisons, its reliance on local jails for state-level incarceration, as well as the presence of federal facilities. The model bill addresses federal prisons by requesting the necessary data from the Bureau of Prisons and includes provisions in case that data is not shared. The state could consider a similar approach for all private prisons in the state, and determine whether it should create a similar approach for all local facilities or just the subset of people who are held in jails for the state or other prison system.  ↩


In planning for the 2030 Census redistricting data, the Bureau acknowledges calls from states to end prison gerrymandering at the source — the Census — but does not signal change.

by Aleks Kajstura, January 30, 2025

The cover of the View from the States Report. Last month the Census Bureau released its “View from the States” report — a collection of states’ feedback about the Bureau’s 2020 redistricting data program. The report is important because it serves as a starting point for planning the 2030 Census and subsequent redistricting data, which states use to draw districts and ensure equal representation in the legislatures.

One of the main complaints from the states this decade was prison gerrymandering — a problem created because the Census Bureau incorrectly counts incarcerated people as residents of their prison cells rather than their home communities. When states use this flawed Census data to draw new districts, they inadvertently give residents of districts with prisons greater political clout than all other state residents.

States have been tackling prison gerrymandering on their own, as the report points out: “…states representing approximately one-half of the U.S. population now have statutory or policy requirements to reallocate specific populations from where they are counted in the decennial census to an alternate location.” In plain English, that means nearly half of the US population now lives in a place that corrects redistricting data they receive from the Census to count incarcerated people at home. These include deep “blue” states like California, “purple” states like Maine and Pennsylvania, and deep “red” states like Montana — where prison gerrymandering-reform legislation received wide bipartisan support.

In this briefing, we break down the 60-page report to highlight states’ dissatisfaction with the Census Bureau for counting incarcerated people in the wrong place and examine the progress and backsliding in the way it publishes population data for correctional facilities.

States say Census’ redistricting data is no longer meeting their needs

Despite the growing number of states that are now adjusting their data to count incarcerated people at home, the Census Bureau still uses outdated notions of incarceration when deciding where incarcerated people “reside.” States made clear to the Bureau that they want this to change.

In the report, the Bureau uses circular logic to justify its flawed way of counting incarcerated people:

“Because the Census Bureau’s residence criteria, which define where the Census Bureau counts people in the decennial census, require people to be counted where they live and sleep most of the time, prisoners are counted in the facility where they are incarcerated at the time of the census.”

Even ignoring the circular nature of the Bureau’s logic, the facts do not support its interpretation of its own definition of residence. It is well-established that in the modern era of mass incarceration, incarcerated people do not “live and sleep most of the time” at the facility where they are held on any given day (including census day). Nationally, 75% of people serve time in more than one prison facility, and 12% of people serve time in at least five facilities before returning home. But even folks who stay in one place while incarcerated are only away from home temporarily; for example, in Rhode Island, the median length of stay for people serving a sentence in the state’s correctional facilities is only 99 days.

States know this and are trying to fix the issue on their own and the Census Bureau even acknowledges this effort and has provided some support to the states. As part of the 2020 Census, the Bureau expanded its tools to help states map their own address data when reallocating incarcerated people to their home communities. The Bureau reports that states “request that the Census Bureau continue this additional support.”

This help is better than nothing, but it still does not meet state redistricting data needs and the states are asking for the Bureau to count incarcerated people at home in 2030. Or as the Bureau phrased it:

States… also ask that the Census Bureau continue to look for additional support possibilities, up to and including a review/revision of where people in GQ [Group Quarters], specifically prisoners, are counted.

2020 changes to the Census were one step forward and two steps back for the states

The most useful thing the Bureau has done to help states count incarcerated people at home on their own was to publish “Table P5” as part of the official redistricting dataset. Table P5 identifies correctional facilities in Census data. In past decades, the information in this table was only available in later Census publications — often too late for states to use in redistricting.

At the same time, the 2020 Census added another wrinkle to prison gerrymandering reform by taking a new approach to its data privacy protections that unintentionally made it harder for states to adjust their redistricting data to count incarcerated people at home. Every decade, the Bureau’s privacy protections ensure that no single person can be identified in the census data and that everyone’s answers on the census forms remain private.

For the 2020 Census, the Bureau implemented a new privacy method called differential privacy, which injects “noise” into the population data published by the census. This “noise” essentially takes the correctional facility populations and adds or subtracts a statistically-determined number of people in the population data published for the census. This change may have accomplished its privacy goals but undermined states’ efforts to address prison gerrymandering because the states’ own facility populations no longer matched the populations reported by the Census.

The Bureau reports:

[The states] appreciated the Group Quarters by Type Table (P5) but requested that the Census Bureau add more detailed GQ types and add race and ethnicity characteristics to that file in 2030. They also requested the GQ total population counts and GQ type be held invariant and not be subjected to changes due to data disclosure avoidance measures.

To translate: providing Table P5 was all well and good, but then the Bureau messed with the data in a way that made things harder to decipher for the states. And so, the states are requesting that the Bureau report correct populations for the facilities. And while they’re at it, it would also be helpful to get race and ethnicity data reported for facility populations as well.

The Bureau acknowledges state needs but makes no promises

In the report, the Bureau acknowledges the states’ struggles to make its redistricting data usable by fixing it to reflect where people actually live. It said it will consider several ways to help states deal with the flawed data:

  • It will continue to publish correctional facility populations as part of the redistricting dataset (the new Table P5) and increase the capacity of its address mapping tools that help the states make their own data adjustments to count incarcerated people at home themselves.
  • In addition, it said it will consider adding more detail to the P5 table, such as race and ethnicity, as well as more details about the facilities themselves (for example, to differentiate between federal and state prisons or local jails).

As far as ensuring that the populations the Bureau’s reports for correctional facilities match the actual number of people they counted there on census day, the Bureau said it will keep that request in mind:

The RVDO [Redistricting & Voting Rights Data Office] is committed to keeping state liaisons informed about any discussions on Census Bureau disclosure avoidance policy changes. The RVDO also recognizes the states’ desire to hold county populations (especially those counties with small populations) invariant and GQ population counts, particularly prisons and college GQs, invariant at the block level and will ensure those requests are part of the discussion.

The Bureau also said that they will once again review the residence rule to determine whether they should count incarcerated people at home. But, considering the Bureau’s history of stubbornly clinging to its outdated way of counting incarcerated people, change is certainly not guaranteed.

States need to prepare to fend for themselves once again for the 2030 Census

In this report, the Bureau gave no indication of whether it is taking steps to count incarcerated people at home in 2030. While we hope that changes, states shouldn’t wait for the federal government to make up its mind. They should take action now to ensure their next redistricting process accurately reflects the makeup of their state.

States that have not yet passed legislation to end prison gerrymandering need to do so soon. This will ensure the state’s Department of Corrections can collect the data needed to successfully count incarcerated people at their home addresses. Our model bill is a great place to start. It provides clear guidance on how this data should be collected, by whom, and how it will be used for the redistricting process.

The View from the States report makes clear that states recognize the Census Bureau’s way of counting incarcerated people is flawed and outdated. What’s less clear is whether the Bureau will listen to the calls for change. Considering the Bureau’s past feet-dragging on this issue, states should take steps now to ensure their democracy is protected from prison gerrymandering, regardless of what the federal government chooses to do.


Census Bureau should conduct small-scale tests of methods for collecting home addresses of incarcerated people to determine how best to implement a revision of the Residence Criteria and Residence Situations for people who are in correctional facilities on Census Day.

by Aleks Kajstura, November 12, 2024

Today, we submitted a joint comment letter from 36 criminal justice, voting rights, and census and data equity advocate organizations in response to the Census Bureau’s recent federal register notice about small-scale tests as part of its planning for the 2030 Census. While the Bureau is only seeking generic clearance — not specifying any particular tests — we took this opportunity to highlight the need for early testing of how best to count incarcerated people at home and end prison gerrymandering .

Prison gerrymandering is a problem created because the Census Bureau incorrectly counts incarcerated people as residents of their prison cells rather than their home communities. As a result, when states use Census data to draw new state or local districts, they inadvertently give residents of districts with prisons greater political clout than all other state residents.

As the comment notes, it has been nearly 20 years since the Census Bureau last considered how it could go about counting incarcerated people at their home addresses. It is past time that that Bureau update that analysis, and the comment letter proposes three specific methods that the Cesnus Bureau should test. If you’d like to read the (rather technical) details, the full letter is available at this link.


The Census Bureau’s current method of counting people in prison and jail is prone to errors with sizable consequences. Counting incarcerated people at home can produce more accurate data.

by Aleks Kajstura, October 30, 2024

It is no secret that the Census Bureau counts incarcerated people in the wrong place — a prison or jail cell — instead of in their actual communities. As a result, when states and local governments use census data to draw new political boundaries during their redistricting process, they inadvertently give residents of districts with correctional facilities greater political clout at the expense of everyone else — a problem known as prison gerrymandering.

For two decades, we’ve worked to fix this problem, but it isn’t the only way that the Census Bureau gets it wrong when counting incarcerated people. The Bureau also routinely mistakenly and unknowingly places prisons and jails in the wrong location in its data or dramatically miscounts them, further distorting political representation across the country. This problem exacerbates prison gerrymandering and warrants further scrutiny.

We examined 2020 Census data to better understand the impact of this often overlooked error. We found that it is not a rare mistake; it is perpetuated across the country and across the decades. And the solution is clear: by counting incarcerated people as residents of their homes the Census Bureau will minimize technical inaccuracies while also ending prison gerrymandering.

The Bureau is wrong to count incarcerated people as if they were residents of correctional facilities

Before looking at the impact of the Census Bureau misplacing or miscounting entire prisons and jails, it is worth revisiting its flawed reasoning for counting incarcerated people at those facilities in the first place.

The Bureau says that it determines where to count people using its “usual residence rule” which says it counts them where they live and sleep most of the time. In attempting to justify its decision to count incarcerated people in prisons and jails, it argued, “counting prisoners anywhere other than the facility would be less consistent with the concept of usual residence since the majority of people in prisons live and sleep most of the time at the prison.”

As we’ve noted before, this is simply not true. Short stays in prison are common. Even people incarcerated away from home for a year or longer do not stay in one place; they are usually moved between multiple facilities. While they are being shuffled between facilities, incarcerated people generally maintain a usual residence elsewhere; their pre-incarceration home remains the only actual stable address. There are plenty more reasons — backed up by hard data — that make clear that by counting incarcerated people at prisons, the Census Bureau is choosing the least accurate option.

The Bureau’s flawed way of counting incarcerated people makes its other mistakes even worse

We often think of the census as a gold standard for population data. And while it is, on the whole, fairly accurate, no matter how careful you are, perfection is not possible when attempting to count over 330 million people.

However, when the Bureau counts an entire prison or jail — which can account for hundreds or thousands of people — in the wrong place, it can have a big impact.

The Bureau routinely misplaces correctional facilities

During the 2020 count, the Census Bureau counted at least one prison or jail in every state in the wrong place. Most of the populations counted erroneously were small, but occasionally, the census reported hundreds or thousands of incarcerated people in the wrong place.

Here are just a few examples from a single state, New York.

The Census Bureau didn’t count any people at Adirondack Correction Facility — a place that holds bout 300 incarcerated people. However, roughly the same number of incarcerated people were counted in a state forest about 175 miles away.1 Our best guess is the Bureau accidentally counted this facility in the wrong place.

Woodbourne Correctional Facility appears to have been counted twice — once in its actual location,2 and also in the empty field next door.3

Empty fields are a common place for the Census Bureau to mistakenly report correctional populations. In Wyoming County, N.Y., rather than counting them in the facility where they were confined, the Bureau counted nearly a thousand incarcerated people in a field,4 and another group of over 800 was reported just across the street from their facility’s location — also in empty fields. This is a perennial problem with the census. In the 2000 Census, the Bureau reported nearly 1800 incarcerated people — likely from the Wyoming Correctional facility in a random field halfway across the county.5

These examples are all just from a single state, and these problems are not confined to New York. The scope of the problem becomes clear when considering that these miscounts and misallocations exist in every state.6

Some might be tempted to argue that the Census Bureau might make similar mistakes if it counted incarcerated people in their home communities rather than counting them at the prison or jail. This would almost certainly happen. Despite its best intentions, the Bureau is not perfect and will make mistakes.

The difference is the size and scale of the mistakes. If the Bureau places a prison that holds hundreds of people in the wrong place, it can severely skew the counts. However, if it counts a single or even several incarcerated people in the wrong place, it would have a negligible impact on political representation and the underlying Census data.

The Bureau’s mistakes create incorrect race and ethnicity data

When the Bureau counts even a single facility in the wrong place, it drops thousands of people into an arbitrary location. This can flip the race characteristics of thousands of people, as the Bureau did in reporting 2020 Census populations for the blocks containing Angola Prison in Louisiana.

The prison accounts for a third of the Parish’s census population, so any population data reported for the prison will heavily influence the demographic picture of the parish. The 2020 Census counted over 4,000 Black people incarcerated at Angola as if they were white. At that time, white people actually accounted for less than a quarter of Angola’s population. Not only does such an error further distort the demographic data of the surrounding parish, but it blatantly obscures the disproportionate toll that mass incarceration places on Black communities.

Furthermore, by creating a false picture of the population in a facility, it also makes it harder for states ending prison gerrymandering to comply with voting rights laws that require accurate race and ethnicity data for drawing districts.

Misplacing prisons & jails exacerbates prison gerrymandering and diminishes trust in the Census Bureau

The Census Bureau’s current approach — counting incarcerated people as if they were residents of a correctional facility — creates inaccurate pictures of communities across the country and leads to prison gerrymandering. This problem is made worse by the Bureau’s persistent, multi-decennial errors that place correctional facilities in random other locations. A single error (and it’s never limited to single errors) haphazardly injects hundreds or thousands of people into a random community’s redistricting data.

Incarcerated people and their families lose trust in the Census Bureau when they don’t believe they are counted in the right place or that they are counted at all.

At a time of increasing distrust in the census, the Bureau should ensure that communities view its data as accurate and feel represented in the process and final results.

The most accurate and equitable solution is to allow incarcerated people to self-enumerate.

Officials at the Census Bureau may worry about how they would implement a change to count incarcerated people in their home communities. The good news for them is they already have a process in place that they use for all other people in the U.S.: simply allow incarcerated people to fill out their census forms themselves — or, as the Bureau calls it, “self-enumeration ” — rather than relying on the facility administrators to provide the date for them. In fact, this is a solution that was already part of the Census Bureau’s plan for the 2020 Census, giving more facility types this option than in 2010.7

States that currently reallocate incarcerated people back home in their redistricting data must now rely on their internal facility or correctional agency records to access home address information. These records are sometimes incomplete. By allowing incarcerated people to self-enumerate, the Bureau would provide states with more accurate and complete data and alleviate state officials of a significant burden.

Not only would this change allow incarcerated people to provide their addresses directly, it would also improve race and ethnicity reporting. Currently, correctional facilities don’t report race and ethnicity data in accordance with census standards. For example, in 2020, correctional facilities failed to report Hispanic status for over a quarter of the people they reported. Moving to self-enumeration would mean a more complete and accurate picture of the demographics of people who are incarcerated.

Of course, despite this, there would still be some non-responses for various reasons, just as people on the outside fail to participate in the census for various reasons. In these circumstances, facility records could still be used to fill in any blanks left after everyone had the opportunity to self-enumerate, ensuring that the 2030 Census is more accurate than prior decades.

If the Bureau chooses not to allow self-enumeration to collect home address data, the Census Bureau can follow the limited-but-tested processes used by the states and rely solely on the data already in the records collected by correctional agencies. Information missing from the records can either be imputed, as the census already does for race and ethnicity data, or, as some states do, continue to count people at the facility if all other efforts fail.

The states have pioneered a variety of paths to counting incarcerated people at home, and the Census Bureau has many more tools, giving it the ability to go far beyond state efforts and create an even more accurate enumeration. At the very least, the Census Bureau can replicate state efforts to count incarcerated people at home.

If the Census Bureau wants to be accurate, it should try something different: count incarcerated people at home

The Bureau’s current way of counting incarcerated people isn’t working. Not only does it dramatically distort political representation, but persistent errors in this data create redistricting chaos far outside the prison walls.

Counting people at home would produce census data that is, on the whole, a more accurate reflection of the population. There are concerns that counting people at home will lead to some inaccuracies because of missing home address data in facility records or non-response from incarcerated people asked to fill out the census themselves. However, the current methods used by the Census Bureau have already resulted in serious inaccuracies in the data. By attempting to count incarcerated people at home, the Census Bureau would be abandoning a seriously flawed status quo and aiming for a more accurate census.

Counting incarcerated people at home is crucial to ensuring equal representation, particularly for communities disproportionately impacted by mass incarceration. In fact, nearly half the US population is now living in a place that has rejected the Bureau’s redistricting data in order to avoid prison gerrymandering. It is time for the Bureau to count incarcerated people at home in order to create a more accurate 2030 Census.

Footnotes

  1. Block 36 065 024400 3084  ↩

  2. Block 36 105 951100 2012  ↩

  3. Block 36 105 951100 2015  ↩

  4. Block 36 121 970600 3018  ↩

  5. Block 36 121 990600 1027  ↩

  6. You can browse through the errors noted in our annotations of 2020 Census correctional populations in our “Correctional Facility Locator 2020” tool, searchable by state. Or in the meantime, here are two more examples:

    • In Michigan, the Kalamzoo County Jail was expected to have a population of at least 400 people; the Office of the Sheriff states that, “The jail regularly supervises over 400 inmates.” Yet, Block 26 077 001801 1000, clearly located at the Sheriff’s office and jail, counts only 27 incarcerated people. The only other block in the vicinity with any incarcerated population has only 12 incarcerated people counted in it.
    • Conversely, in North Carolina, Block 37 165 010400 1004 is clearly located at Scotland Correctional Institution and counts 2,515 incarcerated people at that facility. North Carolina’s DPS website states that Scotland CI has a maximum capacity of 1,756. According to North Carolina DPS’s custom offender reports, there were 1,654 people in Scotland CI on June 30, 2020. There are no other facilities or blocks nearby to which the missing 1,000 people were attributed.  ↩
  7. In the 2020 Census, for example, 2% of people in adult correctional
    facilities and 12% of people in juvenile facilities were counted through self-enumeration.  ↩


We’ve identified over 200 cities and counties that have taken action to avoid prison gerrymandering and some local governments that still continue to base representation on flawed Census Bureau data.

by Aleks Kajstura, September 24, 2024

The movement to end prison gerrymandering started with local governments. Because of their relatively small size, city and county governments often experience the most distortive impacts of the problem. When drawing districts in these communities, a single prison can easily account for an entire city council or county commission district. This not only makes it impossible for officials to draw fair districts, but it also gives some residents as much as five times1 the political clout of other residents of the community.

Prison gerrymandering is a problem created because the Census Bureau incorrectly counts incarcerated people as residents of their prison cells rather than their home communities. As a result, when states and local governments use Census data to draw new political boundaries, they inadvertently give residents of districts with prisons greater political clout than all other residents.

It can be incredibly difficult to know whether a local government has ended prison gerrymandering, but we’ve done much of that legwork for you. We have two pages covering our prison gerrymandering research on local governments — spanning three decades:

Building these lists takes painstaking research. Very few states have centralized records of local redistricting maps, so we reached out to nearly every city, county, and other local government on those lists to figure out whether they ended prison gerrymandering. We gather the maps, analyze the population data, sift through council meeting notes, and interview local officials to come to our conclusions. Sometimes, regional or state organizations do similar research to supplement our efforts, or individuals working in or living in these areas will add their findings to the collection.

There are two important notes about these lists:

  1. As you can guess, it’s impossible to do this research for all of the nearly 40,000 town, city, and county governments in the US. So, we focus on those that are most likely to yield significant or interesting results. As a result, both of these lists are almost certainly undercounts of the places that do — or don’t — engage in prison gerrymandering.
  2. Many states that have passed prison gerrymandering reform laws also cover local governments under those measures. To make the best use of our time and resources, we didn’t research to confirm whether cities or count in those states ended prison gerrymandering, so they don’t appear on these lists.

Because of these two factors, these lists shouldn’t be considered comprehensive or used for any conclusive comparison between decades. These lists are only a partial reflection of the general decline in the number of local governments engaging in prison gerrymandering, and the general increase in local governments avoiding prison gerrymandering, and don’t show the full story of prison-hosting communities increasingly rejecting prison gerrymandering.

We also encourage you to check out our Pathfinder tool, for more information on the issue, including dozens of state-by-state and district-by-district reports, hundreds of articles and fact sheets, and more spread across our website (and even some notable resources from other organizations, too).

These resources provide important information and context about prison gerrymandering for local officials, journalists, and advocates. It can help to show the scale of the problem in their communities, as well as put a spotlight on those places that have taken on the task of solving this problem.

Footnotes

  1. For example, Juneau County, WI contains one of the most prison gerrymandered county commission districts in the nation, where incarcerated people account for roughly 83% of the district’s population. As a result, 17 actual residents of this district have as much political clout as 100 residents of any other district in the county.  ↩


Stay Informed


Get the latest updates:


Share on 𝕏 Donate