Too big to ignore:
How counting people in prisons distorted Census 2000
By Rose Heyer and Peter Wagner
Prison Policy Initiative
April 2004
Section:
Introduction
The Census Bureau counts people incarcerated in state and federal correctional facilities as if they were residents of the prison town. Although incarcerated people are not a part of the community with the prison, they become a part of the community’s statistics. This problem has existed on a technical level since the first Census, but the combination of the expanding use of Census data and of the growth in incarceration makes the issue critical today.
When the Census began in 1790, demographics-based planning and redistricting did not yet exist. The Census’ sole constitutional mandate was and is to count the number of people in each state to determine their relative populations for purposes of Congressional reapportionment. It didn’t matter — for purposes of comparing New York’s population to New Jersey’s — whether an incarcerated person was counted at home in the Bronx or in prison in Attica, as long as they were counted in New York State. Times have changed but Census methodology has not.
Federal, state and local government use Census data to plan programs and distribute funds. Since the 1960s, states and local governments have been required to update their legislative districts each decade to comply with the “One person one vote principle”. Congress now requires the Census Bureau to make its data readily useful to local governments for redistricting purposes[1], and in turn almost all state and local governments base their decennial redistricting on Census Bureau data.
As use of the Census data has evolved, so too has the American population. Until recently, Americans were incarcerated at a very low rate. Prisoners were rare in both absolute and percentage terms. (See Figure 1.) The 1990 Census was the first Census to see a sizable increase in the percentage of Americans in prison, and it was also the first Census to explicitly instruct citizens to not count incarcerated family members.[2]
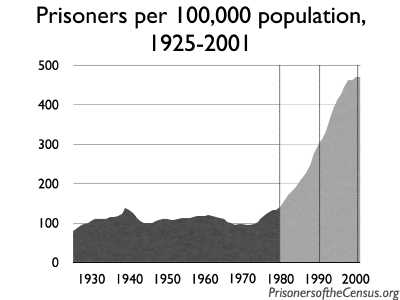
Figure 1. In the 1980 and prior Censuses, households were not explicitly told to exclude prisoners from their count. The 1980 Census was the last Census taken before incarceration rates began to skyrocket.
The impact on Census data is large because prisoners tend to be demographically different from the average population of the country, and because prisoners tend to be incarcerated in communities far removed from their homes.
Although few communities are “average”, incarcerated people are far from the average demographic. Ninety-two percent of people incarcerated in federal and state prisons are men. Blacks and Latinos are only a quarter of the U.S., but are almost 63% of the nation’s incarcerated. (See Figures 2 and 3.)
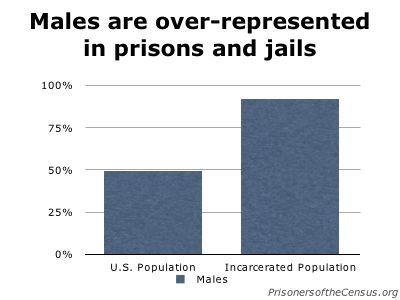
Figure 2.
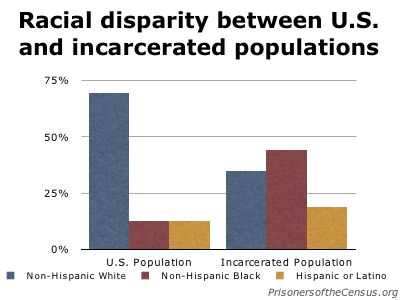
Figure 3.
Prisons tend to be distributed differently than the general population in a state. In New York, 25% of the state lives in the upstate rural and upstate urban areas. Ninety-one percent of the state’s prisoners are incarcerated there, mostly in the upstate rural areas. (See Figure 4.)
Research into the geographic disparities of incarceration is ongoing, but a clear pattern is emerging:
- Sixty percent of Illinois’ prisoners call Cook County (Chicago) home, yet 99% of the state’s prison cells are outside the county.[3]
- Los Angeles County supplies 34% of California’s prisoners, yet only 3% of the state’s prisoners are incarcerated there.[4]
- Philadelphia is the legal residence for 40% of Pennsylvania’s prisoners, but the County contains no state prisons.[5]
- Wayne County (Detroit) is home for 20% of Michigan’s population. Almost 30% of the state’s prisoners are from Wayne County, but only 11% of the state’s cells are there.[6]
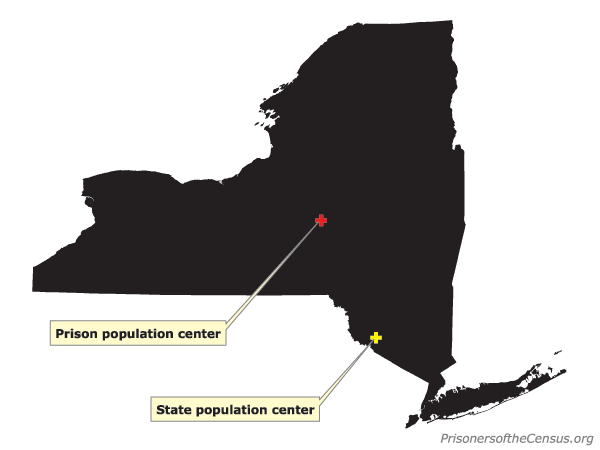
Figure 4. If everyone in New York State stood at their census address on a flat, weightless map of the state, the map would balance near Otisville in Sullivan County, just over the border from Orange. The population center for the 71,466 New York State prisoners, on the other hand, is near Hamilton in Madison County over 100 miles to the north and west.
Footnotes
[1] Public Law 94-171 (1975)
[2] Peter Wagner, Prior to 1990 Census, prisoners were not explicitly excluded from Census counts, PrisonersoftheCensus.org Fact of the Week for December 8, 2003.
[3] Peter Wagner, Diluting democracy: Census quirk fuels prison expansion, April 2004. Prison Policy Initiative.
[4] Peter Wagner, Census counts of prisoners shift population in California, PrisonersoftheCensus.org Fact of the Week for March 15, 2004.
[5] Peter Wagner and Rose Heyer, Pennsylvania State Summary, http://www.prisonersofthecensus.org/pennsylvania.html
[6] Peter Wagner, How Census Bureau counts prisoners undercounts Michigan’s cities, PrisonersoftheCensus.org Fact of the Week for April 5, 2004.
Recommended Reading:
About the Prison Policy Initiative
Learn more about the organization behind the Prison Gerrymandering Project.

The Racial Geography of Mass Incarceration
The transfer of Black and Latino incarcerated people to communities very different than their own is a nationwide problem.

How to get elected without being a candidate first.
Iowa Public Radio explores how Anamosa Iowa ended prison gerrymandering.

The Census Bureau's Miscount: It's about representation, not funding
We explain that prison gerrymandering is bad for democracy but federal & state aid are not impacted.