We are looking for our next Creator-in-Residence to produce engaging and informative social video content about the problems in the American criminal legal system.
Support us
Can you make a tax-deductible gift to support our work?
July 9, 2026: Join the Prison Policy Initiative, Latino Justice, and the MacArthur Justice Center for a powerful webinar focused on the parole board process and the case for the presumption of release. It will begin with a firsthand account from Frank Silva and his interview for freedom followed by Clinical Professor of Law Heidi Rummel and the legality of “presumption of release,” and how California’s framework has shifted the
burden of proof.
No. We oppose voter-only districting — even our recommendation that incarcerated people be excluded in some contexts lends no support to the practice of voter-only districting.
Who should be counted for redistricting purposes? Since the 2010 redistricting cycle, numerous events — from the Supreme Court’s decision in Evenwel v. Abbott to President Trump’s efforts to inquire into citizenship status in the 2020 Census — have drawn attention to this important question. For people interested in our work, an additional query often follows: how exactly should disenfranchised incarcerated people be counted toward district populations?
The fact that questions persist about our recommendations for counting incarcerated people is not surprising: journalists have reported our position inaccurately; advocates for voter-only districting have tried to twist and appropriate our words; and the exclusion of incarcerated people (who generally cannot vote) is one of the solutions to prison gerrymandering that we promote in specific, limited contexts. As a result, some people assume that opponents of prison gerrymandering support voter-only districting.
In advance of the upcoming redistricting cycle, we’d like to make our position on this issue clear: we believe that all persons, whether or not they can vote, are entitled to equal representation and that everyone should be counted for purposes of redistricting. The key concern with prison gerrymandering is not whether incarcerated people should count, but where they should count. Accordingly, districting based on the eligible-voter population is not an approach that we support.
As noted above, we suspect that some of the confusion surrounding this topic arises from our recommendation that incarcerated people be excluded from redistricting data when cities or counties draw local legislative districts around correctional facilities.
To understand why such exclusion does not amount to an endorsement of voter-only districting, it is necessary to see that prison gerrymandering causes two distinct problems: it undermines equality of representation between coequal legislative districts and it siphons political power from incarcerated people’s home communities. Both issues arise from the way the Census tabulates incarcerated populations: it allocates people to their temporary prison addresses, rather than counting them at home (despite the fact that they remain legal residents of their home addresses while incarcerated).
Just like state governments, local jurisdictions — such as cities and counties — have districts that are required to contain equal populations in order to ensure equal representation by local elected officials.
However, as one federal judge has beautifully explained, city councilors, county commissioners, and other local elected officials “can’t make decisions that meaningfully affect” the people incarcerated within their districts, nor can the governing bodies to which those representatives belong do anything for such populations, whose lives are generally governed by state (or even federal) authorities. In other words, unlike other non-voter populations (like children or permanent residents), there is no “representational nexus” between local elected officials and the people detained within their districts. As a result, excluding correctional facilities when local district lines are drawn ensures that districts will have equal numbers of actual residents — and therefore that residents will have truly equal representation.
Unfortunately, local jurisdictions cannot solve the problem of prison gerrymandering in its entirety. While they can avoid creating city or county legislative districts with unequal representation, they cannot — on their own — stop the transfer of political power from people’s home communities. This is because local jurisdictions can refuse to pad their own districts with prisons (by excluding correctional populations prior to drawing district lines), but they cannot restore incarcerated people to addresses outside of their own boundaries. Accordingly, local jurisdictions cannot singlehandedly end the siphoning of political power from incarcerated people’s home communities.
Importantly, the state-level solution is different from the local one; at the state level, exclusion is neither necessary nor beneficial because states can count incarcerated people at their home addresses statewide and thereby solve both parts of the prison gerrymandering problem. Thus, for local jurisdictions, we recommend excluding incarcerated populations prior to redistricting (a partial solution being better than no solution), while our ultimate hope is that states and the Census Bureau will implement the solutions necessary to solve the problem completely.
For all of these reasons, we continue to advocate that using total-population baselines (not eligible-voter populations) is the best method for redistricting, and that incarcerated people should be counted at their home addresses. This total-population approach (sometimes described as the pursuit of “representational equality”) ensures both that elected officials represent the same number of constituents (including those — such as children, non-citizens, and incarcerated people — who cannot vote), and also that officials have a meaningful representational connection to the people they purport to represent. By contrast, efforts to ensure “voter” or “electoral equality” limit representation to only those individuals eligible to cast ballots.
As part of our collection of updated resources for advocates, we have added a fact sheet that addresses local redistricting (and the prison gerrymandering solutions available to local governments). Readers may also wish to explore our other resources for the 2020 redistricting cycle, including a roundup of legislative solutions, as well as an explanation of why prison gerrymandering does not impact federal or state funding allocations.
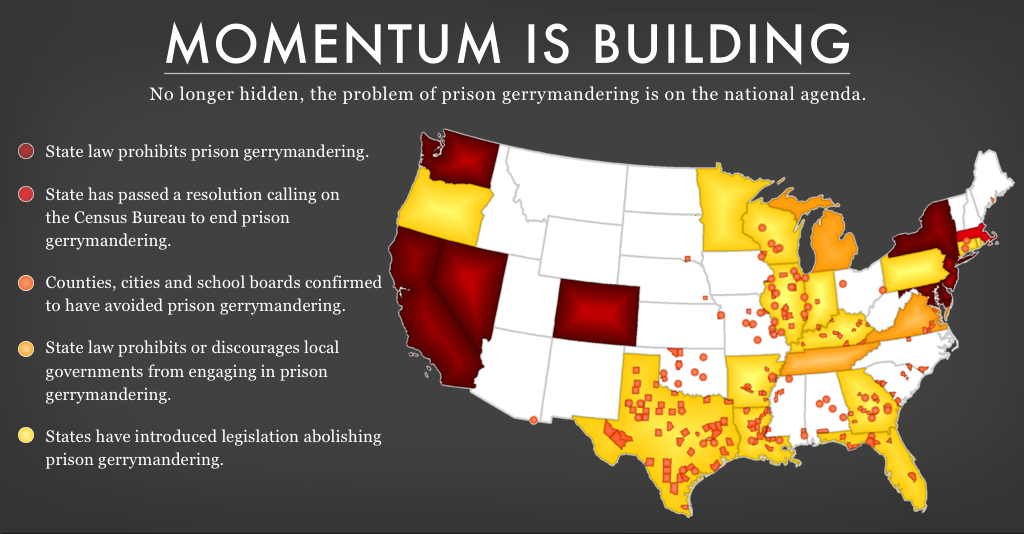
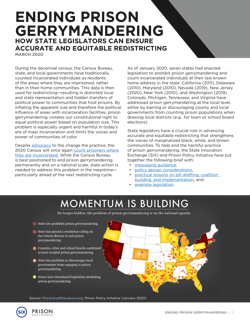
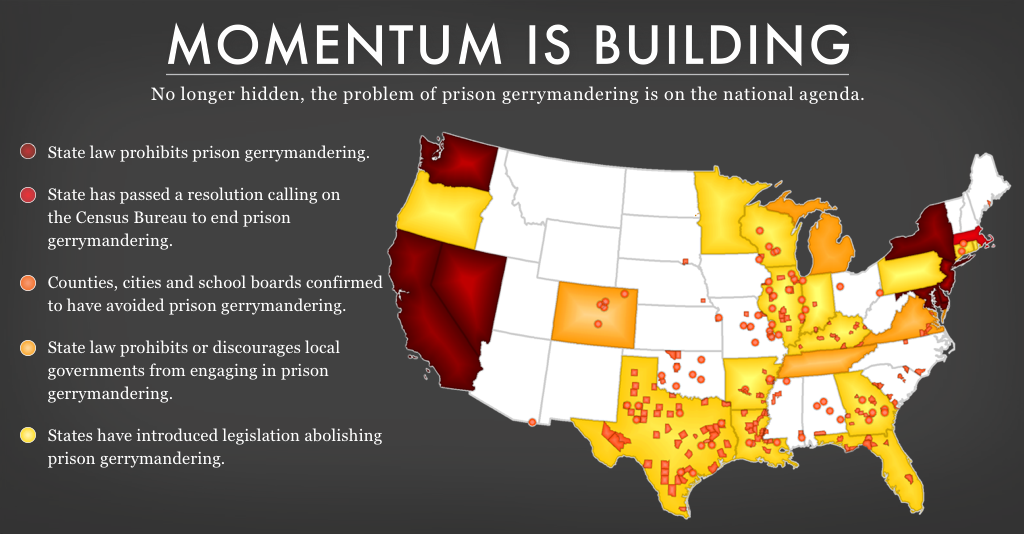
Prison gerrymandering can feel like a complex, political quirk. Talking about Census Bureau policy and how the Bureau interprets its own sometimes-arcane “residence rules” can feel like getting deep in the weeds of policy. But prison gerrymandering is not a fringe issue. It has real-world implications for representation and public policies — and there are proven solutions. Since the Prison Policy Initiative and others have been working to solve this problem, we have seen growing public support and reform legislation passed around the country.
The problems stem from the way the Census Bureau conducts its counts. When counting the population every ten years, the Bureau tabulates incarcerated people as if they were residents of the locations where they are confined, even though they remain legal residents of their homes. When the resulting data is then used to draw legislative districts, all of a state’s incarcerated persons are credited to a small number of districts that contain large prisons. This has the effect of enhancing the representation of those districts and diluting representation of everyone else in the state, distorting policy decisions statewide. And since incarcerated populations are disproportionately Black and Latino, minority voting strength is diluted in the process. (Although this affects representation, it fortunately does not have major funding implications, for various reasons.)
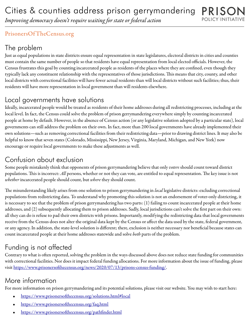
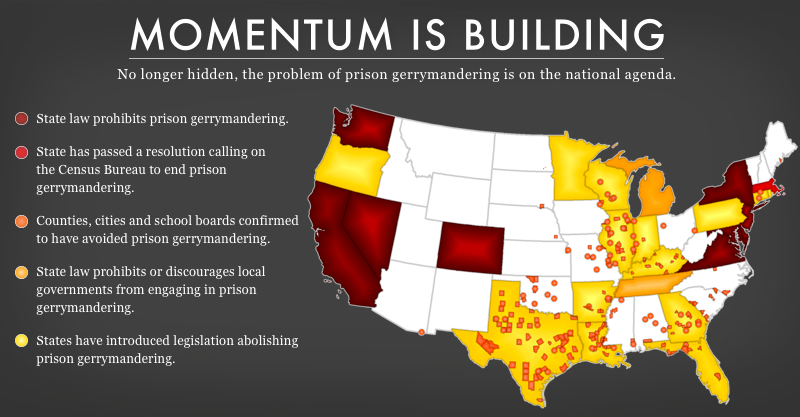
Although prison gerrymandering remains a serious issue in most parts of the United States, there is a growing movement to solve it, and significant progress toward reform has been made at the Census Bureau and at all levels of government across the country. States have the power to use correctional data to adjust Census population counts when drawing districts. Since 2010, nine states — Maryland, New York, Delaware, California, Washington, Nevada, New Jersey, Colorado, and Virginia — have passed legislation to do so, ensuring that districts are drawn with data that counts incarcerated people at home. And more than 200 counties and municipalities independently adjust their redistricting data to avoid prison gerrymandering.
All in all, over 30% of US residents now live in a state, county, or municipality that has formally rejected prison gerrymandering:
Additionally, where states have been unable to implement the most common solutions to prison gerrymandering, they have embraced other options available to them. For example, Massachusetts has not passed legislation, but it found another way to minimize the impact of prison gerrymandering when drawing districts following the 2010 Census, by specifically considering prison populations to ensure that the state would not accidentally (or purposely) concentrate prison populations within a small number of districts. The redistricting committee’s final report on their process devoted significant space to the prison gerrymandering problem and recommended that the Census Bureau create a national solution. The state legislature then doubled down on that recommendation and passed a joint resolution that officially calls on the Census Bureau to count incarcerated people at home. Notably, this solution is still available to any state that cannot pass legislation to count incarcerated people at home in time for the 2020 redistricting cycle.
These actions reflect strong public support for solving prison gerrymandering — and a push for the Census Bureau to change the way it counts in the first place. When the Census Bureau asked for public comment on how incarcerated people should be counted in 2015, over 99% of the 77,863 comments urged the Bureau to count incarcerated persons at their home address. And when the Bureau asked again a year later, almost 100,000 people voiced support for the change, including representatives from civil rights organizations, elected officials at all levels of government, former Directors of the Census Bureau, and citizens from across the country. The reform movement has also drawn editorial support from publications like the New York Times and the Philadelphia Inquirer.
In addition to legislative efforts and public comments, organizations and legislative bodies have shown opposition to the Census Bureau’s prison count and prison gerrymandering, by issuing formal resolutions and recommendations.
As a result of state and local governments’ push to avoid prison gerrymandering, as well as support from advocates and the public, the Census Bureau has recognized that the redistricting data it has historically provided does not meet the needs of those aiming to draw equal districts. Although the 2020 Census still counted incarcerated people as if they were residents of correctional facilities, the Bureau will be publishing prison population counts as part of each state’s redistricting data, making it easier for states and local governments to avoid prison gerrymandering.
As a record number of states and municipalities are poised to tackle prison gerrymandering during the upcoming redistricting cycle, now is the time to join the movement for change.
The Ina Community Center shares a little unassuming building with the Ina Village Hall. The squat single-story structure probably serves the little Illinois village quite well. But judging by their Census population of over 2,300, you wouldn’t think the building adequate.
The village only has 494 actual residents. The 1,800 people who make up the remainder of the Census population are folks who are incarcerated at the Big Muddy Prison. Because the prison is located within the village boundaries, the Census counts them as if they were village residents. That means 80% of the population reported for Ina are legal residents of other villages, towns, and cities, scattered across Illinois.
Ina is just one of nearly 40 municipalities across the US where more than half of the Census population is actually people who were counted at a correctional facility. And in over 100 municipalities, at least one in three people counted by the Census are actually out-of-town residents.
I often talk about how the Census Bureau’s practice of counting incarcerated people as if they were residents of the town that contains the prison causes prison gerrymandering. Prison gerrymandering is the process of using prisons to pad district populations, resulting in increased political representation for people who live near prisons.
But the Census Bureau’s practice skews data in ways that affect more than just redistricting data and representation. When a prison accounts for half of your city population, the Census’ demographic information such as race and ethnicity is not representative of the local residents. Mass incarceration’s disproportionate impact on Black and Latino communities, coupled with prisons being built largely in white communities distorts the Census’ demographic data when people aren’t counted in their home communities. This often paints a distorted picture of job opportunities in the local economy.
Many people assume that prison gerrymandering affects funding allocation, but in fact funding allocation seems to be one of the few data uses left untouched by the Census’ prison miscount. Over the decades, funding formulas have developed a level of complexity that leaves them mostly impervious to the Census Bureau’s odd interpretation of residence.
This year, the Census once again counted all incarcerated people as residents of the facility where they were located on April 1. The population data that will be released over the next few months will therefore suffer from the same deficiencies for another decade; it will once again fail to represent the people who actually live in these communities. For now, places such as Ina can find some relevant information in the Census data, if they know where to look and dig carefully enough. Perhaps by 2030 the Census Bureau will count everyone at home rather than shifting the burden of making its data usable onto everyone else.
Municipalities where at least one third of the Census’ population count is made up of correctional facilities:
Local governments across Louisiana will engage in redistricting after the 2020 Census. When they do, they will once again face decisions about whether to bestow disproportionate political power upon people who live near correctional facilities. The last time this process unfolded (following the 2010 Census), numerous jurisdictions — including parishes (akin to counties), cities, and towns — formed districts that were highly distorted by prison and jail populations.
For example, Allen Parish gave people living in a district with a federal correctional complex twice as much political power as residents who lived in districts without such a facility. Moreover, because Louisiana has the second-highest incarceration rate in the world and more than a dozen state or federal prisons (as well as dozens of local jails), it is unsurprising that these kinds of power imbalances — the result of “prison gerrymandering” — occur in many places throughout the state.
In addition to popping up in different parts of Louisiana, prison gerrymandering also occurs at numerous levels of government, creating problems at the state level (when district lines are drawn for state legislatures) and in parishes, cities, and towns where prison or jail populations typically constitute even larger portions of local district populations. In addition to undermining notions of representational equality, these population imbalances also create inaccurate pictures of community populations for research and planning purposes (although they do not typically impact federal funding, despite frequent assumptions to the contrary).
As we have explained before, prison gerrymandering happens primarily because the U.S. Census Bureau counts incarcerated people as residents of the places in which they are confined, despite the practical reality that (1) most people in prison cannot vote, and many people in jail are effectively barred from doing so (even if eligible), (2) most incarcerated people return to their home communities upon release and remain legal residents of their home addresses even while incarcerated, and (3) local elected officials often have little authority over the lives of people incarcerated within their districts.
While the state legislature in Louisiana engages in prison gerrymandering in drawing state districts, the state’s parishes (and the cities and towns within them) retain the power to utilize Census data to avoid prison gerrymandering when drawing local government districts. Indeed, as the Prison Policy Initiative has previously noted, some local governments in Louisiana have already taken it upon themselves to solve the problem of prison gerrymandering by removing incarcerated people from the districts they have drawn.
Notably, among the parishes with the largest prison populations (proportionally speaking), about half excluded prison populations during redistricting following the 2010 Census. For example, had Claiborne Parish included the prison population contained within its borders, one of the districts in the parish would have been composed entirely of a state prison.
Nonetheless, in many places throughout Louisiana, prison gerrymandering remains a problem. As noted above, Allen Parish is one striking example. The parish’s governing body (its police jury) has seven districts. According to the Census, Allen Parish had a total population of 25,764 in 2010; thus, each of the seven districts in its police jury should have had approximately 3,681 constituents following its 2010 redistricting.
However, Allen Parish relied on non-adjusted Census data to apportion people into those districts, and for one district (District 1) that data included 2,430 people incarcerated at the federal correctional complex within its borders. Using the raw Census data without adjusting it to account for the federal correctional complex meant that 66% of the “constituents” in District 1 ended up being people incarcerated at a federal prison, rather than people who would be meaningfully represented by the district’s elected police juror.
Examples from across the state show that the problem of prison gerrymandering looms large across Louisiana:
Allen Parish:
Police Jury District 1 (as explained above) includes the people incarcerated at the Oakdale Federal Correctional Complex, such that the incarcerated population accounts for 66% of the district’s “constituents.”
Police Jury District 6 includes the people incarcerated at the Allen Correctional Center, such that the incarcerated population accounts for 39% of the district’s “constituents.”
Madison Parish:
Police Jury District 2 includes the people incarcerated at the Madison Parish Correctional Center, such that the incarcerated population accounts for 37% of the district’s “constituents.”
Police Jury District 3 includes the people incarcerated at the Louisiana Transitional Center for Women, such that the incarcerated population accounts for 20% of the district’s “constituents.”
Town of Farmerville
District C includes the people incarcerated at a local detention center, such that the incarcerated population accounts for 42% of the district’s “constituents.”
Examples like these make clear that prison gerrymandering causes serious distortions to representational equality between constituents. In Allen Parish’s District 1, residents get twice the representation that residents of districts without a correctional facility have. Likewise, in Madison Parish’s District 2 (where the prison constitutes 37% percent of the population), every 63 residents in that district get the same degree of representation as 100 residents living elsewhere. Finally, in Farmerville, the jail in District C constitutes 42% of the district’s population, meaning that 58 residents there have the same political power as 100 residents elsewhere.
While the Census could solve the problem of prison gerrymandering in one fell swoop–by counting incarcerated people at home–it has so far declined to do so. In the absence of such a solution, states, counties, and local governments must act (as some Louisiana state legislators are already attempting to do).
Although it appears unlikely that Louisiana will count incarcerated people at home when drawing state legislative districts after the 2020 Census, cities and parishes can still avoid prison gerrymandering at the local level when they redistrict. Doing so will ensure that Louisiana residents have equal access to their parish, city, and town representatives and a fair say in local government.
One of the most common arguments against prison gerrymandering reform is the fear, among people in prison towns, that their communities will lose out on funding. It's a fear based on a misunderstanding of how federal and state funds are allocated.
It’s that time of the decade again when the Census Bureau is hoping to count every single person in the country. Even though the April 1 “Census Day” has passed, the Bureau is still trying to convince the roughly 40% of US denizens that have yet to fill out a form that they should be counted. To persuade the hold-outs the Census Bureau, along with their state and local partners, rely on advertising how much money is riding on the count.
On its website where people can fill out the Census form, the Bureau stresses the financial stakes of counting people correctly: “Census results help determine how billions of dollars in federal funding flow into states and communities each year.” Funding makes an appearance in nearly every mention of how Census data is used. For example: “The 2020 Census will determine congressional representation, inform hundreds of billions in federal funding every year, and provide data that will impact communities for the next decade.”
Those statements are true. But some municipalities, desperate not to lose any population in the decennial count, often resort to putting a price tag on each person’s failure to respond. For example, as local officials in Georgia try to ensure that local residents are counted, the local paper peppers in claims like: “If only one person is counted in a house with four people, it will mean $69,000 less in local coffers over a decade.”
But while it’s true that a lot of funding depends in some way on Census data, this funding isn’t a lump sum that can be converted to a dollar amount per head. In fact, the same series of studies referenced in that Georgia newspaper warn against drawing such false conclusions.
A brief by Andrew Reamer, Research Professor at the George Washington Institute of Public Policy, gives a very detailed walkthrough of the types of population data used to distribute funding. Reamer’s brief makes it clear that per-head calculations are misleading. For a more digestible overview, try looking at a single state, such as Massachusetts. The Massachusetts Secretary of State’s Census 2020, Explained: How It Works and What’s at Stake for Massachusetts has a section on the Census’s funding impact, which correctly notes that some programs “may hardly be affected at all by Census counts.”
These details of the Census’s funding impact tie back to a question we’re getting a lot: Does the way people in prison are counted in the Census impact any particular area’s funding?
The Census Bureau counts incarcerated people at the location of the prison rather than as residents of their home addresses. This demonstrably skews a variety of statistical data for prison-hosting communities. And of course, it creates distorted population counts for determining representation in local and state legislative bodies, resulting in prison gerrymandering. But it does not draw in federal or state funding for the community hosting the prison.
Nine states have passed laws ending prison gerrymandering — adjusting their redistricting data to count incarcerated people at home rather than at the location of the prison — and none of these laws will impact funding distributions based on Census counts. New York and Maryland implemented their laws before the 2010 Census, and have not seen any impact to their formula funding. That makes sense, because no funding formula relies on redistricting data.
One of the most common arguments against prison gerrymandering reform is the fear among prison-hosting communities that they will lose out on funding, which they believe is based on the incarcerated population being counted in the prison town. This misunderstanding of how federal and state funds are allocated shouldn’t hold up reform any longer.
The new law makes Virginia the third state this year, and the ninth state in total, to end the practice known as prison gerrymandering.
April 27, 2020
For immediate release — Last week, Virginia passed Senate Bill 717 and its identical House bill, HB 1255, which ensure that people in state prisons will be counted as residents of their home addresses when new legislative districts are drawn. The new law makes Virginia the ninth state to end the practice known as prison gerrymandering, after Colorado and New Jersey passed their own laws earlier this year. Over 30% of US residents now live in a state, county, or municipality that has ended prison gerrymandering.
The Virginia Constitution states that, for the purposes of voting, people in prison remain residents of their hometowns. However, the Census Bureau counts incarcerated people as residents of the places where they are incarcerated. As a result, when Virginia used Census counts to draw past legislative districts, it unintentionally enhanced the representation of people living in districts containing prisons.
“Virginia’s new law recognizes that ending prison gerrymandering is an important issue of fairness,” said Aleks Kajstura, Legal Director of the Prison Policy Initiative. “All districts — some far more than others — send people to prison, but only some districts contain prisons. Counting incarcerated people as residents of the prison gives extra representation to the prison district, dilutes the votes of everyone who does not live next to the state’s largest prison, and distorts the constitutional principle of one person, one vote. This new law offers Virginia voters a fairer data set on which future districts will be drawn.”
In 2013, Virginia passed House Bill 1339, which ended a state requirement that had forced some local governments to engage in prison gerrymandering. HB 1339 lifted limitations on which counties, cities, and municipalities could exclude incarcerated populations for redistricting purposes. The new law passed last week builds on this progress by explicitly requiring Virginia state and local redistricting officials to count incarcerated people as residents of their home addresses.
Virginia is also considering a constitutional amendment, reforming the state’s redistricting process, that contains similar provisions ending prison gerrymandering. The amendment will be on the ballot for voters to approve in the fall. However, now that SB 717 and HB 1255 have passed, the success or failure of this constitutional amendment will not change how Virginia counts incarcerated people during redistricting.
Over 10 other states introduced legislation to end prison gerrymandering in the current legislative session. “We applaud Virginia for enacting reforms that will allow it to draw fairer state legislative districts,” Kajstura said. “Other states currently considering similar bills will need to act swiftly to ensure that reforms can be implemented for the upcoming redistricting cycle, but unfortunately many states have needed to end their legislative sessions early because of the coronavirus pandemic.”
Virginia’s new law applies only to redistricting, and will not affect federal or state funding distributions.
Colorado moved swiftly, ending prison gerrymandering in a single legislative session.
March 23, 2020
For immediate release — Last Friday (March 20, 2020), Colorado Governor Jared Polis signed a bill into law ensuring that people in state prisons will be counted as residents of their home addresses when new legislative districts are drawn. The new law makes Colorado the eighth state to end the practice known as prison gerrymandering, after New Jersey passed its own law earlier this year.
The Colorado Constitution states that, for the purposes of voting, people in prison remain residents of their hometowns. However, the Census Bureau counts incarcerated people as residents of the places where they are incarcerated.
As a result, when Colorado used Census counts to draw past legislative districts, it unintentionally enhanced the representation of people living in districts containing prisons. The result of this distortion was dramatic: In three state legislative districts, people in prison accounted for 12%, 8%, and 5% of the district’s population. Each of these districts, therefore, had far fewer actual district residents than any other district in the state.
“Colorado’s new law recognizes that ending prison gerrymandering is an important issue of fairness,” said Aleks Kajstura, Legal Director of the Prison Policy Initiative. “All districts — some far more than others — send people to prison, but only some districts contain prisons. Counting incarcerated people as residents of the prison gives extra representation to the prison district, dilutes the votes of everyone who does not live next to the state’s largest prison, and distorts the constitutional principle of one person, one vote. This new law offers Colorado voters a fairer data set on which future districts will be drawn.”
“More accurate district maps, a fairer count of Coloradans, and better population data means a stronger democracy,” sponsors Kerry Tipper and James Coleman argued in The Denver Post last month. “This bill will make a difference for everyone who wants to ensure their districts have the most accurate representation possible.”
The legislation, passed as HB 20-1010, applies only to redistricting and will not affect federal or state funding distributions.
Over 10 other states introduced legislation to end prison gerrymandering in the current session. “We applaud Colorado for enacting common-sense solutions in a single legislative session, and other states currently considering similar bills should follow its example,” Kajstura said.
SiX and the Prison Policy Initiative have released a guide to ending prison gerrymandering for state legislators. Whether you’re new to prison gerrymandering, working on a bill already filed this session, or somewhere in between, there’s something for everyone in this guide — it includes lessons from our previous advocacy, detailed policy recommendations, talking points, and much more.
The Virginia House of Delegates is expected to vote within the next two weeks on SJ18, a constitutional amendment to reform the state’s redistricting process. The amendment and its enabling legislation would also make Virginia the 8th state to end “prison gerrymandering” — ensuring that people in state prisons are counted as residents of their home addresses, and not their prison cells, when new legislative districts are drawn.
Last week, the Senate equivalent of the amendment (SJ18) and enabling legislation (SB203) passed out of the upper chamber. Meanwhile, the House has passed enabling legislation (HB758), but has yet to put the amendment on the floor. Both houses must pass this redistricting reform package by the first week of March so the amendment can go to Virginia voters on November’s ballot.
The House of Delegates should follow the Senate’s lead and pass SJ18. This amendment will bring Virginia one step closer to ensuring equal representation for their residents — a tremendous step forward for civil rights.
Over 25% of U.S. residents now live in a state, county, or municipality that has ended prison gerrymandering.
January 21, 2020
Easthampton, Mass. — Today, New Jersey Governor Phil Murphy signed a bill ending prison gerrymandering — the practice of using prisons to transfer power away from the home communities of incarcerated people, and give it to legislative districts that contain prisons. The state will now draw districts with their home, not prison, addresses.
Senate Bill 758 passed the Senate in February 2019, and the Assembly on January 13, 2020. The bill, now law, caps a campaign to make New Jersey the 7th state to end prison gerrymandering and ensure equal representation for all of its residents. Over 25% of US residents now live in a state, county, or municipality that has ended prison gerrymandering. (The other states are New York, California, Maryland, Delaware, Nevada, and Washington State).
This legislative effort spanned multiple sessions and was supported by many groups, most recently including the New Jersey Institute for Social Justice and the American Civil Liberties Union of New Jersey. The bill’s sponsors included Senators Cunningham and Cruz-Perez, and Assemblymembers Sumter, Mukherji, and Quijano. The sponsors emphasized that the bill will have no effect on federal or state funds in New Jersey. All funding programs have their own data sources that do not rely on redistricting data.
“Prison gerrymandering is a fixable problem of political representation caused by the growth of prison populations in past decades,” said Prison Policy Initiative Legal Director Aleks Kajstura. Like most states, New Jersey bases its legislative districts on U.S. Census Bureau data. Unfortunately, the Census counts incarcerated people as if they were residents of the correctional facility where they happen to be on Census day. When states like New Jersey use this data for redistricting, it leads to unequal representation: People who live near prisons are given extra representation in the state legislature, while every other resident in the state receives less representation.
Senate Bill 758 is a simple state-based solution to a problem that should have been corrected by the federal government. The bill uses the state’s administrative records to reassign incarcerated people to their home addresses before redistricting. Ideally, the U.S. Census Bureau will change its policy and count incarcerated people as residents of their home addresses in the 2030 Census, but for now states should be prepared to have their own solutions in place.
New York and Maryland have already passed and implemented similar laws to count people in prison at home for this round of redistricting, and both states’ laws were successfully defended in court. California, Delaware, Nevada, and Washington State passed legislation that will take effect after the 2020 Census.
As more states take on the task of adjusting Census data to make it usable for drawing equal districts, the Census Bureau has taken some small but very helpful steps. For the first time, the 2020 Census will include correctional population data within the main redistricting dataset (the PL 94-171 file). Identifying the correctional facilities makes the data-crunching easier for states that end prison gerrymandering on their own, and will be particularly useful for states with short redistricting deadlines, such as New Jersey. This data will give redistricting officials the Census counts of people in correctional facilities at the location of the facility — enabling states to subtract incarcerated people from the prison location and, in conjunction with the state’s own home address data, reallocate them back home for that state’s redistricting.
States should follow the lead of New Jersey and Governor Murphy and end prison gerrymandering to ensure equal representation for all their residents.
July 9, 2026: Join the Prison Policy Initiative, Latino Justice, and the MacArthur Justice Center for a powerful webinar focused on the parole board process and the case for the presumption of release. It will begin with a firsthand account from Frank Silva and his interview for freedom followed by Clinical Professor of Law Heidi Rummel and the legality of “presumption of release,” and how California’s framework has shifted the
burden of proof.