by Bernadette Rabuy,
August 20, 2014
 New York Law School professor Erika L. Wood and Dēmos recently released a report, Implementing Reform: How Maryland & New York Ended Prison Gerrymandering. In her report, she shares how Maryland and New York corrected the Census Bureau prison miscount. The Bureau counts incarcerated individuals as if they were residents of their prison cells even though most states bar incarcerated people from voting and most state constitutions and statutes say that a prison cell is not a residence.
As the executive summary in Erika Woods’ excellent report says:
In 2010 and 2011, Maryland and New York took bold steps to correct the problem known as prison gerrymandering, a problem resulting from the United States Census Bureau’s practice of counting incarcerated individuals as residents of their prison cells rather than their home communities. When legislative districts are drawn based on the census numbers, incarcerated individuals become “ghost constituents” of districts that contain prisons. Although in forty-eight states incarcerated individuals cannot vote, have no ties to the local community, are often hundreds of miles from home, and spend an average of just three years in prison, they are allocated to legislative districts in a way that artificially inflates the political power of the districts where the prisons are located, while their home communities—often predominantly poor and minority—suffer the inverse effects of losing representation and voting strength for a decade.
Although the Census Bureau did not change its practice of counting incarcerated individuals in prison on a national level for the 2010 census, Maryland and New York took responsibility for correcting this injustice in their states. In doing so, these two states not only conducted an important experiment in policy innovation, but also demonstrated how various state and local agencies can work together to successfully implement new and important policy reforms to alleviate the problem of prison gerrymandering.
The efforts and coordination by state policymakers, corrections officials, data experts, technicians, planning personnel and lawyers was exemplary and should serve as an inspiration to those across the country who want to take a stand to end this injustice. As a result of their efforts and for the first time in history, the legislative and local districts in Maryland and New York are no longer distorted by prison gerrymandering.
This report provides detailed information about the specific steps Maryland and New York took to implement these new laws based on the 2010 census in conjunction with their redistricting schedules. It details the challenges each state faced as the first in the country to implement this reform—including legal disputes and data deficiencies—and the steps taken to meet and overcome those challenges. It also provides concrete recommendations, based on the experience and expertise of the actors in each state, to assist other jurisdictions in permanently ending prison gerrymandering.
Census Bureau maps locations of correctional facilities, taking another step toward a more accurate count of incarcerated people.
by Peter Wagner,
August 15, 2014
Last fall, the Census Bureau made an important addition to their TIGER mapping system: they added the “footprints” of all of the correctional facilities in the United States. Along with states, counties, cities, rivers, roads and all kinds of geographic entities, the Bureau now has a spatial database of adult prisons, jails, and juvenile institutions.
In my view, this is an essential inventory of the places where 1% of our adult population is currently confined and it should also help the Bureau to, if it so chooses, end the problem of “prison gerrymandering”. The Census Bureau currently tabulates incarcerated people as residents of the prison location, not as residents of their legal home addresses. When state and local governments leave this data uncorrected, they skew legislative districting and dilute the votes of everyone who does not live near a large prison. This new TIGER feature will help the Bureau count people at incarcerated facilities, thereby taking the first step to counting everyone in the right place — making sure they are in fact counted.
Now, for the first time, the Bureau has not just a list of all of the correctional facilities, but also their boundaries. This basic inventory will help in countless ways, ranging from answering basic geographic questions to more complicated population analyses. For example, the footprints will help the Bureau’s Count Question Resolution program settle the frequent disputes about whether a prison is in one community or just over the line in another. Knowing these facility footprints will also help in the Census Bureau’s goal of drawing better Census blocks; currently incarcerated and residential populations are often mixed in a single block. The footprints fulfill an important prerequisite to redrawing block boundaries near prisons so that the blocks follow the facility’s perimeter, thereby keeping the prison population in its own block, making it much easier to disentangle these populations for redistricting purposes or when conducting any population analysis.

At left is a 2010 census block in Franklin County, New York that contains a number of residential houses and two prisons. The map at right shows, in orange, the Census Bureau’s separate footprints for the two state prisons displayed over the 2010 block map. Hopefully, these footprint maps will help with drawing blocks and counting the population for the 2020 Census.
Using the data
The Bureau has made this data available as part of its interactive TIGER system, and this spring we added these maps to our Correctional Facility Locator 2010 tool. Now that we’ve been using this internally for a few months, we wanted to share it with the rest of the people reading this blog.
As you may recall, our correctional facility locator is one of our data tools we developed to make it easier for experts and laypeople to use the Census Bureau’s Advance Group Quarters Summary File which for the first time published correctional facility counts early enough for use in redistricting. As then-director Robert Groves explained:
This decade we are releasing early counts of prisoners (and counts of other group quarters), so that states can leave the prisoners counted where the prisons are, delete them from the redistricting formulas, or assign them to some other locale.
And as we wrote last year, we’ve continued to add in our annotations of the 2010 Census’s group quarters data, including facility names, facility types, and linking in other data on the age, gender and race/ethnicity of the people confined there.
We’ve now added the Census Bureau’s correctional facility footprint data to our tools. If you search for a county in the 2010 Locator you will see a list of blocks that contain correctional facilities in that county along with our annotations. For each block you will also see a link to a map, a link to compare the correctional data for that area with the 2000 Census, a link to a detail page with additional demographic data and other material, and a new “Tiger facility footprint” link that will show the 2010 Census data and our annotations on the left with the Census Bureau’s new footprints data on the right. (See below.) We’ve also made all of the Census Bureau’s metadata on each facility available in a popup window when that facility is clicked on.
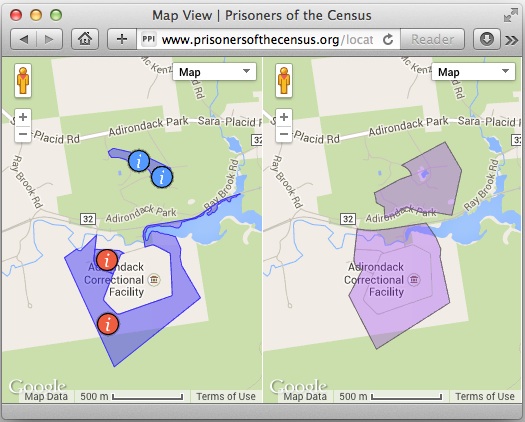
We’ve made the Census Bureau’s new facility footprint data available in our correctional facility locator. (Note, also, the improved spatial accuracy of the new data.)
The Census Bureau makes the periodic updates to its TIGER maps available to the public because it welcomes feedback that would improve its maps of roads, rivers, municipal boundaries, and any other geographies. We’ve already submitted two places where the correctional data could be improved, and our suggestions were quickly verified and accepted. We’re highlighting this new dataset in part so that other data users can start to examine the data and, if they see errors, make suggestions for improvements.
We’d like to see the Census Bureau update its interpretation of the usual residence rule and start to tabulate incarcerated people at their home addresses. One prerequisite is to further improve the Bureau’s understanding of exactly where the prisons are. And with this data, the Bureau is one step closer to achieving that goal.
City of Youngstown, Ohio, is poised to finally redistrict their 30-year old wards and avoid prison gerrymandering while they're at it.
by Aleks Kajstura,
July 29, 2014
Youngstown, Ohio is poised to finally bring voting equality to its residents, after 30 years of inaction and a year of discussion.
The city has not restricted in over 30 years, and according to David Skolnick’s reporting at the Vindicator, “the population in the wards currently range from 7,227 to 12,130, using 2010 census numbers.”
This means that the votes cast by some residents are worth more than others’. Now the Council is redrawing the map to ensure that each ward has more or less the same number of residents, but the presence of several correctional facilities in the city is making that task harder than necessary. The Census Bureau counts incarcerated people as if they were residents of the prison location, even though they remain residents of their home addresses. Youngstown now joins over 200 other local governments around the country in coming up with a solution on their own.
And in the final plan under consideration, the city managed to avoid the pitfalls of prison gerrymandering, mostly:
Despite initial opposition from at least three of seven council members, this map doesn’t count the 2,071 prisoners at the Northeast Ohio Correctional Center on the East Side in the city’s population.
About 75 percent of that prison’s population is illegal immigrants convicted of federal felonies.
The board’s map does include 541 inmates at the Ohio State Penitentiary, also on the East Side, with nearly all its inmates being maximum-security prisoners not from Youngstown, and the 438 prisoners at the Mahoning County jail downtown, with a majority being city residents.
As Skolnick suggests, there is no logical reason why some of the prison populations should be counted as if they were residents of the location of the facility and while others not. Those in state custody are no more residents of the city than those serving their time in the federal facility. And even if some of the folks in the county jail are actual residents of the city, the chances that they’re all residents of the ward that the jail is in are slim.
Luckily, the number of incarcerated people in the state and county facilities is small enough that it’s unlikely to have a significant impact on the wards’ population equality. So when the Council votes on the new map in August, it’ll be taking a huge step in the right direction.
PPI joins 15 other civil rights and democracy organizations in endorsing 10 redistricting principles.
by Aleks Kajstura,
July 10, 2014
We’re excited to have joined 15 other civil rights and democracy organizations in endorsing 10 Redistricting Principles for a More Perfect Union. The Principles, which include a renunciation of prison gerrymandering, serve as “baseline principles to inform redistricting in this decade and future decades, as well as to present a framework upon which to build possible reforms in coming years as we as a nation move toward that more perfect union”:
- Consistent with the requirements of the Constitution, all persons who reside in a state or local jurisdiction — regardless of age, citizenship, immigration status, ability or eligibility to vote — should be counted for purposes of reapportionment and redistricting. Districts should be populated equally, as defined by law, counting all residents as constituents to be represented by elected officials.
- The Census Bureau should continue to improve its outreach and data collection to ensure as full and accurate a count of all communities as possible, including a full and accurate count of the population by race, ethnicity, and national origin. Redistricting decision-makers should use legally-permitted population deviation among districts in state and local redistricting to serve legitimate redistricting considerations, including underpopulation of districts to ensure adequate representation of undercounted communities.
- Incarcerated or detained persons should be considered residents of their immediate pre-incarceration location or their family residence for purposes of reapportionment and redistricting. The Census Bureau should collect and release the data necessary to implement this principle in all jurisdictions.
- Compliance with the letter and spirit of the federal Voting Rights Act and its prohibition of vote dilution and of retrogression must remain a primary consideration in redistricting. While the elimination of racial discrimination in voting is a critical goal, that goal and the protection of civil rights are undermined by decision-makers who deny, without sufficient evidentiary proof, the continued existence of factors, including racially polarized voting, that support the creation of remedial districts under the Voting Rights Act. In light of long-established historical pattern, the prudent course, absent compelling evidence of changed circumstances, is for decision-makers to preserve extant remedial districts under the Voting Rights Act and to create new opportunity districts consistent with growth in relevant populations. Moreover, the requirements of the Voting Rights Act should be viewed as a floor, and not a ceiling, with respect to the voting rights of voters of color in redistricting. To advance these foundational goals, redistricting decision-makers should always make it a priority to exercise their considerable latitude within the law to create coalition and/or influence districts for voters of color where the creation of Voting Rights Act-compliant opportunity districts, in which voters of color comprise the majority of the voting-age population in a district, is not possible.
- Consideration of communities of interest is essential to successful redistricting. Maintaining communities of interest intact in redistricting maps should be second only to compliance with the United States Constitution and the federal Voting Rights Act as a consideration in redistricting.
- Transparency in redistricting is essential to a successful process. Meetings of decision-makers, among themselves or with legal and mapping consultants, must be open and accessible to the public in all but the most limited of circumstances.
- Full access requires the development and implementation of measures to facilitate public attendance and meaningful participation. This includes outreach, informational materials, and interpretation services provided in languages other than English where the constituency involved warrants the provision of such services. This also includes means to permit the participation of constituents in remote locations. All efforts must recognize that certain communities face greater barriers to full participation, and outreach, education, and weighting of input should reflect this recognition. Full access to the redistricting process must also include maximized opportunity for input and participation. This requires facilitating participation through the availability of data and equipment well in advance of the consideration of specific proposals. This also requires timely disclosure of proposed maps being voted upon to allow ample opportunity for public input before adoption. Finally, meaningful participation requires that the decision-making body demonstrate its due consideration of the public input provided.
- Public confidence in redistricting requires the decision-makers to reflect a broad range of viewpoints and be representative and appreciative of the full diversity of the population. Public confidence is furthered when relevant financial and other information about decision-makers and their paid retained consultants is disclosed. Fairness requires the development of clear conflict-of-interest criteria for disqualification of decision-makers and consultants.
- Public trust in redistricting requires disclosure of information about any relationships between decision-makers and significant non-decision-making participants. Transparency requires the avoidance of rules that provide an incentive for outside participants to conceal their relationship to incumbents or candidates for the offices being redistricted. Rules that require participants in the redistricting process to disclose information must be applied evenly.
- Accountability in redistricting requires public access to information about any non-public discussions of redistricting between redistricting decision-makers. This requires advance abrogation of any statutory or common-law legislative privilege that would protect such discussions of redistricting by decision-makers from disclosure during or after conclusion of the process.
Article explores prison gerrymandering in Alabama, highlighting problems in creating equal representation in city council wards and state legislative districts.
by Aleks Kajstura,
July 1, 2014
The Anniston Star recently published a great article by Tim Lockette: Captive constituents: Prison population beefs up some Alabama districts.
Lockette explores how the Census Bureau’s decision to tabulate incarcerated people at the location of the correctional facilities impacts redistricting in Alabama:
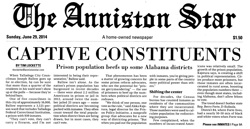 When Talladega City Councilman Joseph Ballow goes up for re-election, he can be sure that more than a quarter of the residents in his ward won’t show up at the polls — because they’re behind bars.
One of five councilmen in this city of approximately 16,000, Ballow represents a 3,121-person ward that includes Talladega Federal Correctional Institution, a prison with 939 inmates.
“They can’t vote, they can’t carry a firearm, and I’m not interested in being their representative,” Ballow said.
Bellow’s attitude toward the folks incarcerated in his district is not unique, and it’s consistent with state law that says incarcerated people remain residents of their home address, and therefore constituents of the representatives of their home communities.
City and state officials say Talladega politicians typically see the prison as a burden.
“The question has always been, ‘Do we have to take it?,'” said Dawn Landholm, principal planner for the East Alabama Regional Planning and Development Commission, which has drawn district lines for many local cities, including Talladega’s ward lines after the 2000 Census.
Landholm said council members tend to feel cheated if they get a district that doesn’t include lots of actual registered voters. Council members have often asked if they can count only the voting-age population in drawing districts, she said.
“We’ve had to tell them they can’t just draw the district around voters,” Landholm said. “You have to take everybody.”
I agree with Landholm, districts should be based on actual population. And that means Talladega can follow the lead of over 200 local governments across the country that successfully avoid prison gerrymandering by removing the out-of-town-resident incarcerated population from their redistricting data. In fact it looks like some folks in town are already thinking about it:
Talladega City Manager Brian Muenger said he’s heard of other cities that discount the inmate population when drawing districts. He said he’d be open to proposing a similar option for Talladega.
The problem extends far beyond Talladega’s city wards. Prison gerrymandering impacts state legislative districts as well because the state replies on the same flawed Census data for redistricting:
The architect of Alabama’s post-2010 redistricting plan, Sen. Gerald Dial, R-Lineville, said the state did the best it could with the numbers it has.
Fair redistricting is hard enough without incarcerated populations being tabulated in the wrong place, so ideally the Census Bureau would change where it counts incarcerated people and provide states with redistricting data that reflects people at their actual home address. But in the meantime cities such as Talladega can adjust their redistricting data to exclude incarcerated populations, and Alabama can join California, Delaware, Maryland and New York by passing state-wide legislation to count people at home for redistricting purposes.
Op-ed in Providence Journal supports ending prison gerrymandering, published the same day bill dies in House Judiciary Committee
by Aleks Kajstura,
June 25, 2014
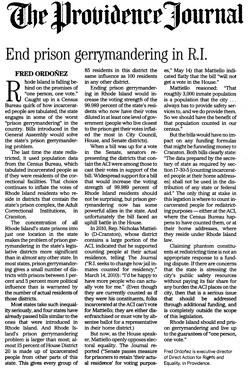 On Saturday, the Providence Journal published an op-ed by Fred Ordoñez, executive director of Direct Action for Rights and Equality, calling on Rhode Island to end prison gerrymandering.
Ordoñez explained the severity of Rhode Island’s prison gerrymandering problem:
The concentration of all Rhode Island’s state prisons into just one location in the state makes the problem of prison gerrymandering in the state’s legislative districts more significant than in almost any other state. In most states, prison gerrymandering gives a small number of districts with prisons between 1 percent and 5 percent more political influence than is warranted by the number of actual residents of those districts.
Most states take such inequality seriously, and four states have already passed bills similar to the ones that were introduced in Rhode Island. And Rhode Island’s prison gerrymandering problem is larger than most; almost 15 percent of House District 20 is made up of incarcerated people from other parts of this state. This gives every group of 85 residents in this district the same influence as 100 residents in any other district.
Ending prison gerrymandering in Rhode Island would increase the voting strength of the 99.989 percent of the state’s residents who now have their votes diluted in at least one level of government (people who live closest to the prison get their votes inflated the most in City Council, House, and Senate districts).
When a bill was up for a vote in the Senate, senators representing the districts that contain the ACI were among those to cast their votes in support of the bill. Widespread support for a bill that would increase the voting strength of 99.989 percent of Rhode Island residents should not be surprising, but prison gerrymandering now has some powerful allies in the state. And unfortunately the bill faced an uphill battle in the House.
(Read the entire op-ed here.)
Unfortunately, the same day the op-ed was published the bill to end prison gerrymandering in Rhode Island, S 2286A, died in the House’s Judiciary Committee. But given the enthusiasm in the Senate, I’m sure the bill will be reintroduced again next session.
Rome, NY still has not redistricted after the 2010 Census, city fails to implement NY's law to end prison gerrymandering.
by Aleks Kajstura,
June 23, 2014
Over 3 years after New York counties and cities were prohibited from engaging in prison gerrymandering, and prison-adjusted redistricting data was made available, the city of Rome is still stalling on redistricting.
The city continues to rely on wards that are padded with incarcerated populations, including people that were incarcerated at the now-closed Oneida Correctional Facility. Redistricting will be on the council’s agenda once again this week, but they’re holding out on implementing any potential plan until 2016.
That’s a long time to wait for democracy.
Analysis of voter registration and turnout is muddled by Census Bureau counting incarcerated people in the wrong place.
by Aleks Kajstura,
June 18, 2014
How well does our nation do with voter turnout? Thanks to the Census Bureau, we may not really know. Voter registration and turnout are common metrics for gauging the health of our democracy, but the numbers are easily skewed by Census Bureau methodology that counts incarcerated people in the wrong place.
A recent report, Unequal Access: A County-by-County Analysis of Election Administration in Swing States in the 2012 Election, from the Center for American Progress Action Fund, used the Census’s population data to rank counties by the percentage of the county’s population that was registered to vote, and the percentage that actually turned out to vote.
The report based its numbers on CVAP (Census Voting Age Population); CVAP gives you a rough estimate of the number of folks eligible to vote. It seems like just the sort of number you’d want to judge your turnout against. But since the Census counts incarcerated people as if they are residents of the county where the correctional facility is located, things can go terribly wrong with the math.
DeKalb County, Missouri, for example is ranked as second-worst in the state for both voter registration and turnout. But that’s because roughly a quarter of the people the Census counted there were not actually residents of the county, but rather folks incarcerated at two state prisons that happened to be located there.
The people incarcerated in those prisons are very likely not residents of DeKalb, and therefore not eligible to vote in the county (whether or not they are disenfranchised by the state). Taking the prison populations into account when looking at the voter registration and turnout, the County’s numbers look much better (middle to top of the rankings).
The simplest solution for getting accurate election data would be for the Census Bureau to just count incarcerated people at home, where they reside. In the meantime, the best practice for researches is to use the Bureau’s group quarters data to adjust Census-reported population when doing voting analyses.
McAlester, Okla. inadvertently forced itself to engage in prison gerrymandering after the 2010 Census, is now seeking charter amendment to solve the problem.
by Aleks Kajstura,
June 18, 2014
You may remember McAlester, Oklahoma, the city that historically avoided prison gerrymandering, but was reluctantly prison-gerrymandering its wards in 2011, having inadvertently bound themselves to do so in a recent charter amendment.
Today I’m pleased to report that McAlester is well on its way to solving the problem by revising its charter once again to allow the city to exclude incarcerated populations from the data the city uses to draw the city council wards. Just last week, the city council approved a resolution (Proposition V) that will put the charter change on the August ballot for voters’ approval.
The charter amendment will be up for a vote on August 26, hopefully I’ll be able to report back that McAlester residents chose to end prison gerrymandering once again in the city.
PPI Research Associate Sarah Hertel-Fernandez reports back from a hearing in a suit to protect the residents of Cranston, RI from prison gerrymandering.
by Sarah Hertel-Fernandez,
June 16, 2014
Having recently returned to the office as a summer Research Associate, I have had the opportunity to reflect on my time as an intern last semester. Most of my time was spent in the office, but on a very rainy Wednesday in April, I accompanied the Prison Policy Initiative’s staff to Rhode Island to observe the hearing for Davidson vs. Cranston. Beyond being a welcome interruption my midterms at Smith College, it was a change to see both PPI and the broader legal system in action.
As I listened to Peter, Aleks, and Leah reviewing the case and the schedule for the day on the ride to Providence, I was reminded by each of them in turn that I could and should ask questions.
I had started my once-a-week internship in January 2014, and besides being a crash course in prison reform, it had been a continuous, continuing lesson in learning how to ask the right questions. Through a series of small research projects and the guidance of the staff, I’d been learning how to frame research projects, how to be flexible with that framework, and what goes into making that research presentable and compelling. When investigating the ways in which inequality is created and sustained, and imagining how more equitable systems might take their place, both existing problems and their possible solutions must be made clear to your audience.
The hearing illustrated the importance of how research is presented. The plaintiffs were not incarcerated individuals but rather residents from other wards whose voting power was diluted by prison gerrymandering. A statistic, calculated from Census Bureau data, was repeated by Adam Lioz, the lawyer for the plaintiffs from Demos: three voters from the district where the prison population was counted have a much voting power as four from another. It was framed as a violation of the “one person, one vote” principle of equal representation, skewing population data that is used to apportion that representation. When oral arguments must be so concise, presentation is vital.
It was a reminder to me that the damage done by the prison gerrymandering is not just visited upon the communities from which prisoners (and their voting power) are taken. It distorts our whole political landscape. It was a day of sidestepping puddles between the ACLU office and the courthouse, learning about the planning and collaboration that went into this lawsuit, and realizing once again the importance of this work in the company of people who work well together.
I’m grateful for this opportunity to continue working with PPI, and I know I will take what I learn wherever my academic and professional life takes me.

Left to Right: Peter Wagner (Executive Director, PPI), Aleks Kajstura (Legal Director, PPI), Adam Lioz (Counsel, Demos), Brenda Wright (Vice President, Legal Strategies, Demos), Leah Sakala (Policy Analyst, PPI), Sarah Hertel-Fernandez (Research Associate, PPI).


