Massachusetts legislature urges the Census Bureau to end prison gerrymandering by tabulating incarcerated people at their home address.
by Aleks Kajstura,
August 22, 2014
Today, the Massachusetts legislature passed a bipartisan resolution (SB 309) that “urges the Census Bureau, in the next Census and thereafter, to provide states with redistricting data that counts incarcerated persons at their residential address, rather than the address of the correctional institution where they are temporarily located”.
The resolution will now be delivered to the Director of the Census Bureau.
The entire resolution is worth a read:
Continue reading →
Census Bureau asked to solve prison gerrymandering nationally, save states from each having to adjust Census data on their own.
by Aleks Kajstura,
August 22, 2014
Three U.S. Senators recently wrote a joint letter to the Census Bureau, reiterating that the Census’ current methodology of tabulating incarcerated people as if they were residents of the prison location rather than of their home addresses leads to prison gerrymandering. Noting that the Census Bureau is in the best position to end prison gerrymandering nationally — saving the states from each having to adjust Census data themselves — the Senators asked the Bureau to inform them of the “steps it is taking in the near term” toward counting incarcerated people as residents of their home address.
The Senators’ letter, along with others written to the Census Bureau, can be found on our letters page.
Census Bureau's ethnographic study recommends further research in counting incarcerated populations: suggests improvements to use of administrative data and a look at collection of home addresses.
by Aleks Kajstura,
August 22, 2014
The next decennial census is still 6 years away, but the Census Bureau is already running tests and exploring areas for methodological improvement. As part of this process, the Bureau commissioned and released an ethnographic study of incarcerated populations that analyzed how the Census Bureau could count incarcerated people more efficiently while improving accuracy. Although technically not about tabulating incarcerated people at home, we think this ethnographic study fulfils an important prerequisite to the Bureau’s exploration of counting incarcerated people at their home addresses.
The authors describe how, unlike most Americans who fill out a Census form for themselves or their family, incarcerated people are often counted using facilities’ administrative records. This method is sometimes quicker and easier but often results in less accurate data.
But how well do these records serve Census purposes? Ultimately that is the question the authors sought to answer:
Does the use of administrative records meet the goals of the census of “counting everyone in the right place and the right time”? …As has been asserted repeatedly, administrative rosters in correctional systems meet the first half of the census requirements by counting everyone present in these group quarters on the day the rosters are obtained. They are less successful in meeting the next goal of everyone in the right place”….
…these administrative records are least successful in answering valuable questions about race and ethnicity and home addresses. Addressing these questions will provide specific directions for the planning of Census 2020 in correctional group quarters.
The study presented many examples of the shortcomings of administrative records, for example:
Misalignment between official census categories of race and ethnicity and the administrative rosters resulted in subjective, and often arbitrary, [Census form] completions.
…
While names, birthdays and gender are highly reliable in correctional administrative records, the mismatch between federal labels for race and ethnicity and widely variant labels used in these correctional systems illustrate the need to examine these important categories to improve census coverage.
Given some advanced planning, however, the use of administrative records could be a great time-saver for the Census Bureau (and correctional staff). Relying on administrative data could save the Census Bureau from having to visit each prison individually. Instead, the Bureau could simply have a single contact in a state’s Department of Corrections to gather census data for every facility under their jurisdiction. The authors explain how such an agency-level approach can benefit the Census Bureau:
Investing time in an agency approach presents additional benefits for accuracy and cost-savings. Working closely with agency programmers, preparation for the 2020 Census could result in more consistent definitions of the race and ethnic categories both across the system and with the established census categories. Gaining knowledge of the structure and content of these databases could also result in the development of “census subroutines” in electronic form, eliminating the need to code data from hard copies into census machine-readable forms.
Such an approach would not be appropriate for the over 3,000 county jails, with one exception. The large, urban jails are likely to maintain databases similar to these prisons and could be included in a modified agency approach.
Although technically outside the scope of the inquiry, the authors return to the issue of home addresses several times, recommending that “A separate study of the availability and accuracy of these records would have to be designed and implemented.” A recent report, published after the ethnographic study, by a New York Law School professor Erika L. Wood and Dēmos, Implementing Reform: How Maryland & New York Ended Prison Gerrymandering, tackles some of those questions.
The study also points out the internal dissonance in the way the Census Bureau interprets its residence rules for incarcerated people, especially those in jail:
For example, a person arrested at 11:00 p.m. on March 31 may appear on the roster on April 1 but released back into the community later in the day on April 1 and thus not meet any census definition of residence in the jail.
And as the authors point out, this incongruity also leads to a potential overcount of people incarcerated in jails:
Jails, with a high level of population turnover, may present a challenge as their inmates may be counted in both housing unit and GQ [correctional population] enumerations.
So far in this post I have described the parts of the report that are most relevant to our prison gerrymandering work, but I cannot stress enough the wealth of information found in this report on a wide range of issues relating to the enumeration of incarcerated populations. In addition to identifying a few main problems and making recommendations, the report includes a 10-page detailed documentation of the enumeration process in the facilities under study. These pages (section 4 and its subparts) shed light on the census process from the facilities’ perspective and provide great insight into possible approaches for improving future censuses.
The full report is certainly worth a read, and represents a great foundation for the Census Bureau’s potential progress toward more accurate enumeration of America’s incarcerated populations.
We run the numbers. It's almost everyone.
by Peter Wagner,
August 21, 2014
Prison gerrymandering dilutes your right to vote in every level of government in which it operates, so basically the entire state benefits from reform. And, counter-intuitively, some of the biggest beneficiaries of ending prison gerrymandering are rural people who live near large prisons.
First, let’s take a step back and recall two key facts:
-
Vote enhancement in the district with the largest prison dilutes the votes of the residents of every other district.
Mathematically, the impact of crediting incarcerated people to the prison districts is larger than the impact of not crediting them at home because incarcerated people come from all over the state – albeit often disproportionately from some places rather than others – but the prisons concentrate these incarcerated people to a small number of locations. This creates some vote enhancement in every district that contains a prison, but even most of those districts’ residents get less representation than people in the one district with the largest prison population.
And, the vote enhancement in the prison districts is generally so large that it disadvantages rural communities that neither contain prisons nor send very many people to prison almost as much as the typically urban district that loses the largest number of people to the Census Bureau’s prison miscount. In sum, the biggest harm from prison gerrymandering comes not from the vote dilution in the districts that send the largest numbers of people to prison, rather it comes from the larger vote enhancement in the handful of districts that contain the prisons.
-
The effects of prison gerrymandering are the most dramatic at the state and local levels of government because these districts tend to have the smallest populations.
While a cluster of large prisons typically has a negligible effect on a Congressional district of 700,000 people, the impact of a single 1,000-person prison can be massive in a county commission district of only 1,200 people. District sizes vary, but in general you can think of Congressional districts as generally being the largest, and in order of decreasing typical size, state senate districts, state house districts, county districts, and finally city districts and school boards.
So if prison gerrymandering benefits the residents of a particular district, wouldn’t that mean that every state has hundreds of thousands of people who live in such districts and have a vested interest in protecting their unearned political clout during redistricting? Actually, no.
While there are a lot of people who benefit at the state senate level, many of those same residents see larger harms at the level of the state house and local government districts.
Here are some calculations we ran last fall that illustrate how this works:
When New York was still engaging in prison gerrymandering in 2002, Senate District 45 contained 12,989 people incarcerated in state and federal prisons and was 4.34% incarcerated, giving the residents of that district extra influence in comparison with the 61 other rural, and suburban and urban districts that have no or fewer prisons within their borders. But not all residents of the 45th Senate District benefit from prison gerrymandering equally. Less than half (44%) of the district lived in the 114th Assembly District which was 6.99% incarcerated. The remainder of people who lived in Senate District 45 were in two Assembly districts that contained far fewer prison cells than the 114th.
All three counties in the 114th Assembly District contain prisons, but the vast majority (88%) of the residents of that district live in County Board of Supervisors, County Board of Legislators, or County Legislature districts that do not contain the largest prisons. New York’s decision to outlaw prison gerrymandering ended the resulting vote dilution in one or more levels of government that had been plaguing all but roughly 15,300 people in a state of 19 million. And, of course, all 19 million people benefit when the democratic process improves.
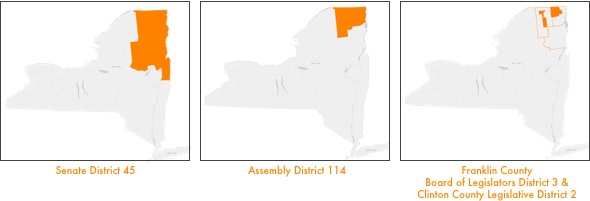
New York Senate District 45, Assembly District 114, and on the third map, Franklin County Board of Legislators District 3/Clinton County Legislature District 2. Essex County is outlined in that map but the Essex County Board of Supervisors district with the largest prison is not pictured because that district is not within Assembly District 114. Note that each of these districts may appear large on the map, but the number of people living in these areas is quite small (and the U.S. Constitution requires us to base districts on population, not land area).
Or, to say it another way, prison gerrymandering is bad for 99.92% of the people living in New York State. And New York isn’t alone. I found the same thing when I analyzed to Rhode Island’s districts. Out of the entire state, only 112 people simultaneously live in the state senate district and the state house district with the largest prison population. Everyone else in the state has their vote diluted in one or both chambers as a result of prison gerrymandering.
This animated illustration overlays a map of all of the Rhode Island Senate districts that do not contain the largest prison populations and a map of the house districts that do not contain the largest prison populations over a map of the Cranston area.
If we superimpose the Cranston City Council Ward map over the map of the state house and state senate districts discussed above, we see that even most ward 6 residents — who dramatically benefit from prison gerrymandering at the city council — have their votes diluted in one chamber of the state legislature:
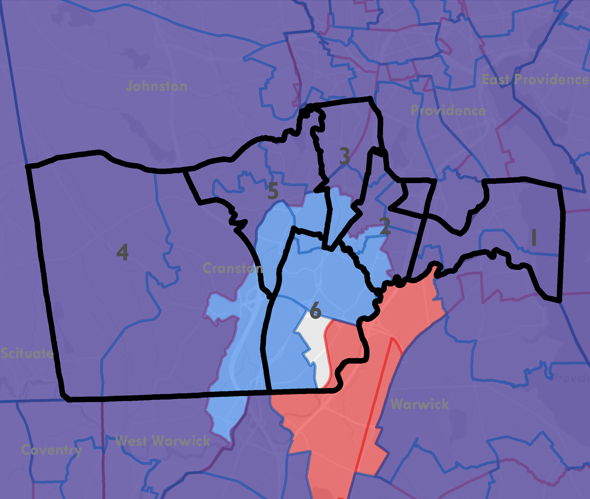
Only 112 non-incarcerated residents of Cranston Ward 6 who benefit from prison gerrymandering in the city council do not also live in a state house or state senate district where their votes are diluted by prison gerrymandering.
So what portion of Rhode Island will benefit from ending prison gerrymandering? It’s 99.989% of the people. That’s no doubt a large part of why the Rhode Island Senate last session unanimously passed a bill that would end prison gerrymandering in the state. (And why the House hasn’t passed that bill is a discussion for another day.)
by Bernadette Rabuy,
August 20, 2014
 New York Law School professor Erika L. Wood and Dēmos recently released a report, Implementing Reform: How Maryland & New York Ended Prison Gerrymandering. In her report, she shares how Maryland and New York corrected the Census Bureau prison miscount. The Bureau counts incarcerated individuals as if they were residents of their prison cells even though most states bar incarcerated people from voting and most state constitutions and statutes say that a prison cell is not a residence.
As the executive summary in Erika Woods’ excellent report says:
In 2010 and 2011, Maryland and New York took bold steps to correct the problem known as prison gerrymandering, a problem resulting from the United States Census Bureau’s practice of counting incarcerated individuals as residents of their prison cells rather than their home communities. When legislative districts are drawn based on the census numbers, incarcerated individuals become “ghost constituents” of districts that contain prisons. Although in forty-eight states incarcerated individuals cannot vote, have no ties to the local community, are often hundreds of miles from home, and spend an average of just three years in prison, they are allocated to legislative districts in a way that artificially inflates the political power of the districts where the prisons are located, while their home communities—often predominantly poor and minority—suffer the inverse effects of losing representation and voting strength for a decade.
Although the Census Bureau did not change its practice of counting incarcerated individuals in prison on a national level for the 2010 census, Maryland and New York took responsibility for correcting this injustice in their states. In doing so, these two states not only conducted an important experiment in policy innovation, but also demonstrated how various state and local agencies can work together to successfully implement new and important policy reforms to alleviate the problem of prison gerrymandering.
The efforts and coordination by state policymakers, corrections officials, data experts, technicians, planning personnel and lawyers was exemplary and should serve as an inspiration to those across the country who want to take a stand to end this injustice. As a result of their efforts and for the first time in history, the legislative and local districts in Maryland and New York are no longer distorted by prison gerrymandering.
This report provides detailed information about the specific steps Maryland and New York took to implement these new laws based on the 2010 census in conjunction with their redistricting schedules. It details the challenges each state faced as the first in the country to implement this reform—including legal disputes and data deficiencies—and the steps taken to meet and overcome those challenges. It also provides concrete recommendations, based on the experience and expertise of the actors in each state, to assist other jurisdictions in permanently ending prison gerrymandering.
Census Bureau maps locations of correctional facilities, taking another step toward a more accurate count of incarcerated people.
by Peter Wagner,
August 15, 2014
Last fall, the Census Bureau made an important addition to their TIGER mapping system: they added the “footprints” of all of the correctional facilities in the United States. Along with states, counties, cities, rivers, roads and all kinds of geographic entities, the Bureau now has a spatial database of adult prisons, jails, and juvenile institutions.
In my view, this is an essential inventory of the places where 1% of our adult population is currently confined and it should also help the Bureau to, if it so chooses, end the problem of “prison gerrymandering”. The Census Bureau currently tabulates incarcerated people as residents of the prison location, not as residents of their legal home addresses. When state and local governments leave this data uncorrected, they skew legislative districting and dilute the votes of everyone who does not live near a large prison. This new TIGER feature will help the Bureau count people at incarcerated facilities, thereby taking the first step to counting everyone in the right place — making sure they are in fact counted.
Now, for the first time, the Bureau has not just a list of all of the correctional facilities, but also their boundaries. This basic inventory will help in countless ways, ranging from answering basic geographic questions to more complicated population analyses. For example, the footprints will help the Bureau’s Count Question Resolution program settle the frequent disputes about whether a prison is in one community or just over the line in another. Knowing these facility footprints will also help in the Census Bureau’s goal of drawing better Census blocks; currently incarcerated and residential populations are often mixed in a single block. The footprints fulfill an important prerequisite to redrawing block boundaries near prisons so that the blocks follow the facility’s perimeter, thereby keeping the prison population in its own block, making it much easier to disentangle these populations for redistricting purposes or when conducting any population analysis.
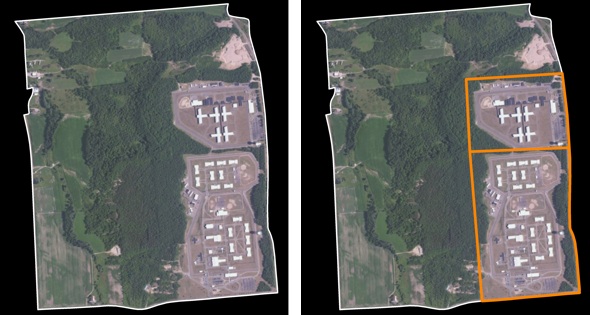
At left is a 2010 census block in Franklin County, New York that contains a number of residential houses and two prisons. The map at right shows, in orange, the Census Bureau’s separate footprints for the two state prisons displayed over the 2010 block map. Hopefully, these footprint maps will help with drawing blocks and counting the population for the 2020 Census.
Using the data
The Bureau has made this data available as part of its interactive TIGER system, and this spring we added these maps to our Correctional Facility Locator 2010 tool. Now that we’ve been using this internally for a few months, we wanted to share it with the rest of the people reading this blog.
As you may recall, our correctional facility locator is one of our data tools we developed to make it easier for experts and laypeople to use the Census Bureau’s Advance Group Quarters Summary File which for the first time published correctional facility counts early enough for use in redistricting. As then-director Robert Groves explained:
This decade we are releasing early counts of prisoners (and counts of other group quarters), so that states can leave the prisoners counted where the prisons are, delete them from the redistricting formulas, or assign them to some other locale.
And as we wrote last year, we’ve continued to add in our annotations of the 2010 Census’s group quarters data, including facility names, facility types, and linking in other data on the age, gender and race/ethnicity of the people confined there.
We’ve now added the Census Bureau’s correctional facility footprint data to our tools. If you search for a county in the 2010 Locator you will see a list of blocks that contain correctional facilities in that county along with our annotations. For each block you will also see a link to a map, a link to compare the correctional data for that area with the 2000 Census, a link to a detail page with additional demographic data and other material, and a new “Tiger facility footprint” link that will show the 2010 Census data and our annotations on the left with the Census Bureau’s new footprints data on the right. (See below.) We’ve also made all of the Census Bureau’s metadata on each facility available in a popup window when that facility is clicked on.
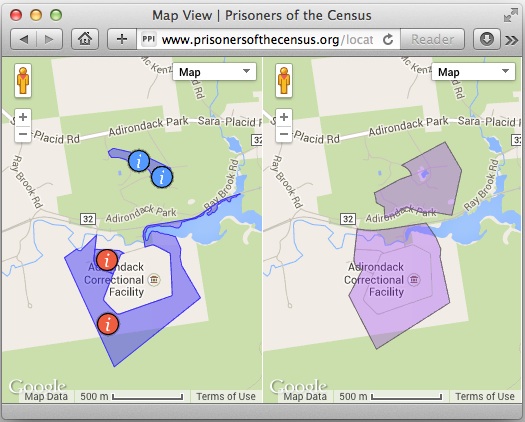
We’ve made the Census Bureau’s new facility footprint data available in our correctional facility locator. (Note, also, the improved spatial accuracy of the new data.)
The Census Bureau makes the periodic updates to its TIGER maps available to the public because it welcomes feedback that would improve its maps of roads, rivers, municipal boundaries, and any other geographies. We’ve already submitted two places where the correctional data could be improved, and our suggestions were quickly verified and accepted. We’re highlighting this new dataset in part so that other data users can start to examine the data and, if they see errors, make suggestions for improvements.
We’d like to see the Census Bureau update its interpretation of the usual residence rule and start to tabulate incarcerated people at their home addresses. One prerequisite is to further improve the Bureau’s understanding of exactly where the prisons are. And with this data, the Bureau is one step closer to achieving that goal.


