Can you help us continue the fight? Thank you.
—Peter Wagner, Executive DirectorDonate
Imported “Constituents”: Incarcerated People and Political Clout in Connecticut
- Sections:
- Foreword
- Introduction
- Redistricting requires accurate population data
- Connecticut residence law and voting law
- Failing to fix the problem of prison gerrymandering in 2011 dilutes most votes cast today
- Recommendations and precedent
- Acknowledgments
- About the author
- About the organizations
- Footnotes
Report by Peter Wagner, Prison Policy Initiative
Foreword by Bilal Dabir Sekou, PhD, and Cheri Quickmire, Common Cause in Connecticut
April 17, 2013
Foreword
The practice of counting people who are incarcerated at their temporary prison cells rather than their legal addresses makes a mockery of the principle of “One Person, One Vote”. The effort to end prison gerrymandering in Connecticut is the next logical step in a 373-year-long journey towards greater electoral equality.
For more than 300 years after the founding of Connecticut’s General Court in 1640, political representation was based on towns, not people. As a result, by 1960, less than 10% of the state had the power to elect the majority of the state House of Representatives.
Fortunately, change did come. As an exhibit in the lobby of the Legislative Office Building explains: “spurred by the civil rights struggles in the South, federal courts began enforcing the constitutional principle of ‘one man-one vote’” to ensure equal representation for all races, ethnicities, and regions. The courts rightly required Connecticut to abandon the system of basing representation on towns and instead to shift to basing representation on population.
At the time, the small towns objected to the changes. As that same exhibit explains, the representative from New Milford complained that “Reapportionment’s effect on the small towns of the state is somewhat akin to a fly swatter’s effect on flies ‘sudden traumatic and final.’” But the benefits to the state were as profound as they were sudden.
Immediately, the Connecticut Legislature began to be more responsive to the needs of the state and more representative of the state’s population. Under the old town-based system, only once was an African-American elected to serve in the House. In 1965, the very first election after the population based districts were enacted, the state elected six African-Americans to the State House and the first African-American to the State Senate.
We have made great strides towards more equitable electoral representation here in Connecticut, but we have much more work to do. This report addresses a critical next step in our march towards protecting the voting strength of people of color: ending the pernicious practice of prison gerrymandering that transfers their political clout to predominately white communities.[1] Connecticut must move from relying on U.S. Census Bureau data that counts incarcerated people at the locations of correctional facilities, to counting them at their home addresses for redistricting purposes.
Introduction
The U.S. Census Bureau counts incarcerated people as residents of the communities that contain correctional facilities, even though under Connecticut state law incarcerated people remain legal residents of their homes. Because the state of Connecticut relies on this data to apportion political power on the basis of population, crediting thousands of mostly urban and minority people to the wrong communities has staggering implications for our system of representative democracy. The phenomenon has come to be known as “prison gerrymandering.” [2]
How the Census Bureau assigns residence to incarcerated people would be nothing more than a matter of statistical trivia if the number of incarcerated people was small, but the combined population in the state and federal prisons in Connecticut on Census Day was 19,698.[3] That’s a population almost large enough to be an entire state house district.[4]
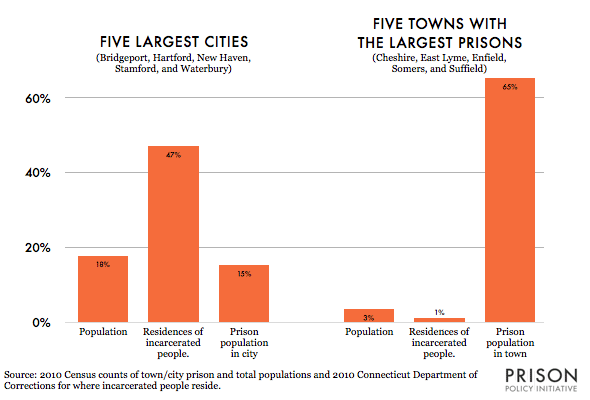
Almost half of the state’s incarcerated people come from the five major cities, but nearly every town in the state had at least one resident incarcerated on Census Day.[5] Though the prison population comes from many communities, it is concentrated in just a few: almost 2/3rds (65%) of the state’s prison cells were located in just 5 towns: Cheshire, East Lyme, Enfield, Somers, and Suffield:
Crediting incarcerated people to the wrong locations has profound implications for the redistricting process because of the stark racial disparities in the Connecticut prison system.
The African-American population in Connecticut is incarcerated at a rate 10.6 times the rate of Whites, and Latinos are incarcerated at a rate 4.6 times as often as Whites.[6] Connecticut, which is majority White, has a prison system that is almost two-thirds people of color.[7] Incarcerated people are being credited to communities that are demographically distinct: the five towns that contain the majority of the state’s prison cells are all majority-White. (And of the people of color in these five towns, a large portion (32%-79%) counted in the Census as “residents” is actually incarcerated residents of other parts of the state.)
Redistricting requires accurate population data
The basic principle of our democracy is that political power should be distributed on the basis of population. Each decade after the census, Connecticut redraws its legislative districts to ensure that each district contains roughly the same population as other districts, giving every citizen equal access to the legislature. When districts are of substantially different sizes, the weight of each vote starts to differ: in underpopulated districts, each vote is worth more, and in overpopulated districts, each vote is worth less.
This principle of “one person, one vote” has, since a series of U.S. Supreme Court rulings in the 1960s, ensured that every person has the same access to government as everyone else, regardless of where he or she lives.[8] As the Supreme Court explained, population-based redistricting is required because “[l]egislators represent people, not trees or acres. Legislators are elected by voters, not farms or cities or economic interests.”[9]
Unfortunately, the entire process of drawing districts that each contain approximately the same number of people breaks down when a state relies on data that counts an entire population in the wrong place. Crediting many thousands of incarcerated people to census blocks where they do not reside significantly enhances the weight of votes cast in districts that contain prisons, and dilutes the votes cast in every other district.
Connecticut residence law and voting law
While the Census Bureau tabulates incarcerated people as residents of correctional facilities rather than at their home addresses, using that data for redistricting may violate the Connecticut state law that declares, like most other states do, that a prison is not a residence. A legal residence is the place that people choose to be and do not intend to leave, unlike a prison cell. The statute is explicit:
No person shall be deemed to have lost his residence in any town by reason of his absence therefrom in any institution maintained by the state. (Sec. 9-14.)
While Connecticut law prohibits people incarcerated for a felony from voting,[10] about 28% of the prison population retains the right to vote either because those individuals are not convicted and awaiting trial or because they were sentenced for only a misdemeanor.[11] The statutes are explicit that when these individuals vote, they must do so as residents of their home communities:
Any person in the custody of the state being held at a community correctional center or a correctional institution, whose voting rights have not been denied, shall be deemed to be absent from the town or city of which he is an inhabitant for purposes of voting…. (Sec. 9-14a.)
Failing to fix the problem of prison gerrymandering in 2011 dilutes most votes cast today
In Spring 2011, the General Assembly failed to pass a bill that would have ended prison gerrymandering in the state[12] and that summer the Reapportionment Committee ignored suggestions that would have minimized the effects of the Census Bureau’s prison counts.[13] Instead, the Reapportionment Committee drew its districts based on the flawed Census data that counted incarcerated people in the wrong place, and the fairness of the districts suffered.
Seven of the house districts drawn by the Connecticut General Assembly in 2011 use, to meet their required populations, a substantial number of incarcerated people whose home addresses are in other districts. The effects are striking. The majority-white residents of 7 state House districts, for example, get significantly more representation in the legislature because each of their districts includes more than 1,000 incarcerated people of color from other parts of the state. (See Table 1)
| District | Rep (2013) | Party (2013) | Facilities | District population (Census) | State and federal prison population | Incarcerated people of color | Percent of district incarcerated |
|---|---|---|---|---|---|---|---|
| 37 | Jutila, Ed | D | York Correctional Inst. and Gates Correctional Inst. (now closed) | 23,310 | 2,014 | 1,298 | 8.6% |
| 42 | Bowles, Timothy R. | D | Corrigan-Radgowski Correctional Center | 23,663 | 1,511 | 1,051 | 6.4% |
| 52 | Bacchiochi, Penny | R | Osborn and Northern Correctional Institutions | 23,531 | 2,339 | 1,603 | 9.9% |
| 59 | Kiner, David W. | D | Robinson, Willard-Cybulski and Enfield Correctional | 24,314 | 3,374 | 2,345 | 13.9% |
| 61 | O Brien, Elaine C. | D | MacDougall-Walker Correctional Institution | 23,448 | 2,137 | 1,565 | 9.1% |
| 103 | Adinolfi, Al | R | Manson Youth Inst. and Cheshire Correctional Inst. | 23,005 | 2,103 | 1,590 | 9.1% |
| 108 | Smith, Richard A. | R | FCI Danbury and Camp | 23,531 | 1,339 | 1,000 | 5.7% |
For example, State House District 52, (Somers) claims more than 2,300 people of color as constituents. But the majority (57%) of that population is not actually residents of the district, but rather is temporarily incarcerated in the Osborn and Northern Correctional Institutions. The problem of crediting people of color to districts where they do not reside is not limited to the 52nd district: 83% of the state’s prison cells are located in disproportionately White house districts.[14]
And in the Senate, District 7, represented by Senator Kissel, included 7,850 people incarcerated in six correctional institutions in the Enfield/Somers/Suffield area:
| District | Senator (2013) | Party (2013) | Facilities | District population (Census) | State and federal prison population | Incarcerated people of color | Percent of district incarcerated |
|---|---|---|---|---|---|---|---|
| 7 | Kissel, John A. | R | Robinson, MacDougall-Walker, Willard-Cybulski, Enfield, Osborn, and Northern Correctional Institutions | 102,622 | 7,850 | 5,513 | 7.6% |
The consequence of relying on unadjusted Census Bureau data to draw legislative districts is to enhance the weight of a vote cast in the districts that contain the state’s largest prison complexes and to dilute the votes cast in every other district.
There are several districts in Connecticut where approximately 10% of the population is incarcerated people who are legal residents — and often voters — of other districts. By failing to correct for the Census Bureau’s prison miscount, the state has said, in essence, that every 9 people who live near a large prison shall be represented in the state capital as if they were 10 people from any other district.
Recommendations and precedent
Barring a federal or state decision to end prison gerrymandering, the concentration of large prisons in just a few towns virtually guarantees that prison gerrymandering will always be a problem for Connecticut. The state’s house districts are simply too small — and the state’s prison complexes too large — to draw the districts any other way.[15]
Ideally, the Census Bureau would update its methodology and begin tabulating incarcerated people as residents of their pre-incarceration homes. But, as the federal government can be slow to act, four states have already implemented viable state-based solutions.
Maryland, New York, Delaware, and California require that Census Bureau data be adjusted prior to redistricting so that incarcerated people are counted at their homes instead of in prisons cells.[16] The Maryland and New York laws were passed in 2010, just in time to influence the current round of redistricting. Both laws were upheld in the courts, including, in the case of Maryland, by the U.S. Supreme Court.[17]
Maryland faced one of the most dramatic instances of prison gerrymandering in the nation, with a house district that was 18% incarcerated. But the other three states all have impacts smaller than that seen in Connecticut, but they passed their legislation because it was the right thing to do for electoral fairness.
Beyond these four states, more than 200 rural counties and municipalities, including the Connecticut towns of Cheshire and Enfield, currently reject the Census Bureau’s prison counts when drawing their local government districts. Because a single prison could easily be the majority of a county or muncipal district, local government bodies are often the first to reject prison gerrymandering by developing alternatives to the Census Bureau’s prison counts.
The town of Cheshire, for example, uses registered voters to draw municipal districts. Otherwise, one district would have been about 20% incarcerated. Enfield found a different solution by simply ignoring the prison complex for the purpose of drawing the town council boundaries. If the city had based its districts on Census Bureau counts that included the prison population, 30% of the third district’s population would have been incarcerated, giving every group of 7 residents near the prison as much influence over local government affairs as 10 residents elsewhere in the city. That wouldn’t have been fair to the voters of Enfield.
Enfield and Cheshire have the right idea: The Census Bureau counts incarcerated people in the wrong place, and state and local governments must take action to ensure that the weight of a resident’s vote is not determined by where he or she lives.
Acknowledgements
The research and publication of this report was supported in part by generous grants from the Open Society Foundations, the Public Welfare Foundation and a network of individual donors who want to see an end to prison gerrymandering nationwide.
About the author
Peter Wagner is an attorney and Executive Director of the Prison Policy Initiative. For more than a decade, he has been the leading authority on how Census Bureau prison counts distort the legislative redistricting process, and his research has influenced legislation to end prison gerrymandering in New York, Maryland, Delaware and California. His recent publications include “Breaking the Census: Redistricting in an Era of Mass Incarceration” in the William Mitchell Law Review (Spring 2012).
About the organizations
Common Cause in Connecticut is a nonprofit, nonpartisan citizens lobby dedicated to improving the way state government operates. Whether it is advocating for opening committee meetings to the public or compelling the passage of the strongest campaign finance law in the nation, Common Cause in Connecticut has been a leading voice in reforming state government.
The non-profit, non-partisan Prison Policy Initiative was founded in 2001 to demonstrate how the American system of incarceration negatively impacts everyone, not just the incarcerated. The Easthampton, Massachusetts based organization is most famous for its work documenting how mass incarceration skews our democracy. Other projects have included groundbreaking reports about sentencing enhancement zones and the prison telephone industry, and online resources to give activists, journalists and policymakers the tools they need to participate in setting effective criminal justice policy.
Footnotes
[1]See testimony of Leah Aden, Assistant Counsel, Political Participation Group NAACP Legal Defense and Educational Fund, Inc., 04/01/2013 at http://www.prisonersofthecensus.org/testimony/Leah_Aden_Support_HB_6679_4-1-13.pdf/
[2]See New York Times Editorial Board, “Prison-Based Gerrymandering,” May 20, 2006. Available at: http://www.nytimes.com/2006/05/20/opinion/20sat3.html (accessed April 16, 2013)
[3]This is the total of the state and federal correctional facilities in Connecticut as counted by the Census Bureau and published in the Advance Group Quarters Summary File. This data is made more accessible online at http://www.nytimes.com/2006/05/20/opinion/20sat3.html although we note that the Manson Youth Institution does not appear in that table because the Census Bureau classified the facility as a juvenile institution. (See: http://www.prisonersofthecensus.org/locator2010/errata.txt) This facility, however, appears in the Advance Group Quarters Summary File and the shapefile of this data made available at http://www.prisonersofthecensus.org/data/2010/groupquartersshapefile.html
[4]The state and federal prison population would be 83% of the ideal district size of 23,670 for a 2011 Connecticut house district.
[5]Christopher Reinhart, Town of residence of incarcerated inmates, Office of Legislative Research, Connecticut General Assembly, March 22, 2010 available at http://www.prisonersofthecensus.org/ct/ct_town_of_residence_03102010.pdf. This study, conducted just three weeks before Census Day, finds that only Bridgewater and Sherman had no residents incarcerated in the state prison system.
[6]Based on Connecticut Department of Corrections, January 1, 2010 Statistics, available at http://www.ct.gov/doc/cwp/view.asp?a=1505&q=454174 and Census Bureau Summary File 1, Table P9. (We used the Census category of “Non-Hispanic White” in order to ensure compatibility with Department of Corrections data.)
[7]Based on Connecticut Department of Corrections, January 1, 2010 Statistics, available at http://www.ct.gov/doc/cwp/view.asp?a=1505&q=454174 and Census Bureau Summary File 1, Table P9. (We used the Census category of “Non-Hispanic White” in order to ensure compatibility with Department of Corrections data.) The numbers for each town are: Cheshire: 34%, East Lyme: 39%, Enfield: 32%, Somers: 79%, and Suffield: 63%.
[8]See Reynolds v. Sims, 377 US 533 (1964) and progeny.
[9]Reynolds v. Sims, 377 US 533, 562 (1964)
[10]General Statutes of Connecticut §9-46.
[11]Analysis based on the July 1, 2010 population reports from the Department of Correction available at http://www.ct.gov/doc/cwp/view.asp?a=1505&q=462756 and a Sentenced Inmate Population report from the Connecticut Department of Correction Management Information Systems Unit for April 1, 2010.The population labeled as “Federal Charges” (394 people) by the Department was assumed to be eligible to vote, while the population with “Unclassified” sentences (3,735 people) was assumed to be ineligible to vote. If many of the people with “Unclassified” sentences can vote, the portion of people who can vote would be higher than 28%.
[12]See HB6606, An Act Concerning the Determination of the Residence of Incarcerated Persons for Purposes of Legislative Redistricting, March 16 2011
[13]See the testimony of Common Cause in Connecticut at http://www.prisonersofthecensus.org/testimony/ct_Hynes_testimony_6_30_11.pdf and of the Prison Policy Initiative at http://www.prisonersofthecensus.org/testimony/wagner_ct_testimony-2011-July-5.pdf
[14]See Appendix Table H available at http://www.prisonersofthecensus.org/ct/appendix_house.html. Only districts 5, 93 and 129 contain both a state or federal correctional facility and a larger than average population of people of color. (These Hartford, New Haven and Bridgeport districts are in fact, a majority people of color.)
[15]For a detailed analysis of the effects of prison populations on district deviations, see Appendix H available at http://www.prisonersofthecensus.org/ct/appendix_house.html. While the details can vary from decade to decade, the general magnitude of prison gerrymandering in Connecticut is unavoidable.
[16]Prison Policy Initiative, Prisoners of the Census Legislation Webpage. Available at: http://www.prisonersofthecensus.org/legislation.html (accessed April 16, 2013).
[17]Maryland’s law was affirmed by the U.S. Supreme Court Fletcher v. Lamone, __ U.S. __, 2012 WL 1030482 (June 25, 2012) affirming No. RWT-11cv3220 slip op. (D. Md. Dec. 23, 2011). New York’s law similar law was upheld in state court (Little v. New York State Task Force on Demographic Research and Reapportionment No. 2310-2011 slip op. (NY Sup Ct. Dec. 1, 2011)). The decisions and documents from both cases are archived at http://www.prisonersofthecensus.org/fletcher/ and http://www.prisonersofthecensus.org/little/
[18]See White v. Regester, 412 U.S. 755 (1973).
[19]Existing public data on the homes of incarcerated people is only available at the town level, so while we know that Hartford had 2,631 incarcerated people in the state who come from Hartford, we can't know exactly how many are from a particular district within Hartford. A change in the law would make this data available to the Reapportionment Commission.
Recommended Reading:
About the Prison Policy Initiative
Learn more about the organization behind the Prison Gerrymandering Project.

The Racial Geography of Mass Incarceration
The transfer of Black and Latino incarcerated people to communities very different than their own is a nationwide problem.

How to get elected without being a candidate first.
Iowa Public Radio explores how Anamosa Iowa ended prison gerrymandering.

The Census Bureau's Miscount: It's about representation, not funding
We explain that prison gerrymandering is bad for democracy but federal & state aid are not impacted.