- Sections
- Introduction
- Section 1: Getting started
- Section 2: Accessing Census data
- Section 3: Calculating the impact on districts
- Section 4: Repairing your democracy, now and in the future
- Tools
- Correctional Facility Locator (2020)
- Correctional Facility Locator (2010)
- Correctional Facility Locator (2000)
- Vote dilution calculator
- 2020 Worksheet [DOC] a single worksheet updated for use after the 2020 Census to determine if a county included or excluded the incarcerated population.
- Worksheets [DOC] with all of the tables used in this toolkit
- Appendices
- Handling lettered blocks
- Determining whether prisoners were included or excluded from districts with known populations.
- District population deviations & split prisons
- Weighted Voting
Appendix:
District population deviations & split prisons
This Democracy Toolkit recommends trying to get the actual population of each district, but we warned that this may be difficult because this information may no longer exist in a readily accessible form. Because reverse engineering a paper map to produce the Census population figures is beyond the scope of this toolkit, we recommended calculating the ideal district size for the districts and using that figure in place of the unavailable exact population of each district.
However, some people who are lucky enough to have the exact district population figures may notice that the districts are not exactly equal. In some cases, this fact may intersect with the question of vote dilution caused by prisoner counts. This appendix discusses this intersection and help you parse some common scenarios by which county officials say "We included the prisoners but ...." and they really mean that they excluded the prisoners from the districts.
As you know, legislative districts are redrawn each decade to ensure that each district contains the same number of people, thus ensuring that each resident has the same access to government. For example, a 5-seat legislature in a county with 10,000 people should have 5 districts of 2,000 people:
| District | Census population |
|---|---|
| 1 | 2,000 |
| 2 | 2,000 |
| 3 | 2,000 |
| 4 | 2,000 |
| 5 | 2,000 |
But the districts might not be exactly equal. Because of how the Census blocks are shaped, it may not be possible to draw the districts exactly equal. Or more commonly, legislatures try to keep "communities of interest" together but in the process exact equality becomes difficult. Typically, legislatures can draw districts that are 5% smaller than the average or 5% larger than the average to protect "communities of interest" or other interests (including incumbency) without violating the Supreme Court's "One Person One Vote" rule. (Note: this is sometimes called the 10% rule, because districts that are -5% too small and +5% too big have a total deviation of 10% of an ideal district size.)
So imagine that in the hypothetical county below, one district is 5% too large and another is 5% too small:
| District | Census population |
|---|---|
| 1 | 2,100 |
| 2 | 1,900 |
| 3 | 2,000 |
| 4 | 2,000 |
| 5 | 2,000 |
Those districts would just barely meet the requirements of equal population. But what if the county contained a 100 person prison? If the prison was in district 2, the district that was already short population, the vote enhancement in that district would be even larger. The district was too small to begin with and the population figures they used contains many non-residents. On the other hand, if the 100 person prison was in district 1, the actual vote enhancement would be negligible because the actual population would be quite close to the ideal population of 2,000.
We have seen examples of either situation and some places in between. We have also seen county officials give some well-intentioned but misleading explanations of how they drew their districts. We will explain through some examples.
In some counties, officials have told us that "We included the prisoners, but we deliberately drew the district with the prison larger to compensate."
If the county official was describing a situation in a county with 10,000 residents and 1,000 prisoners like this:
| District | Census population | Resident population | Prison population |
|---|---|---|---|
| 1 | 3,000 | 2,000 | 1,000 |
| 2 | 2,000 | 2,000 | 0 |
| 3 | 2,000 | 2,000 | 0 |
| 4 | 2,000 | 2,000 | 0 |
| 5 | 2,000 | 2,000 | 0 |
where district 1 is larger than the other districts by the size of the prison population, it is really the equivalent of drawing the districts without the prison population. In fact, the resident population of each district is the same as the ideal district population after excluding prisoners. (11,000 in the census - 1,000 prisoners = 10,000 local residents / 5 districts = 2,000 ideal district size. If the county was intending to include the prisoners, the ideal district size would have been 11,000 / 5 = 2,200.)
On the other hand, if the county official was describing a situation like this:
| District | Census population | Resident population | Prison population |
|---|---|---|---|
| 1 | 2,500 | 1,500 | 1,000 |
| 2 | 2,000 | 2,000 | 0 |
| 3 | 2,000 | 2,000 | 0 |
| 4 | 2,000 | 2,000 | 0 |
| 5 | 2,000 | 2,000 | 0 |
where the prison district was just somewhat larger than the other districts, than the vote enhancing impact of the prison population would be moderated but not eliminated. This example is not the equivalent of excluding the prisoners prior to redistricting.
Similarly, we have discovered some examples where a county splits up the prison in to multiple pieces so that each district contains a portion of the prison. For example, again imagine a county that has a Census population of 10,000, which includes 2,000 prisoners. The county draws 4 districts of 2,500 people:
| District | Census population |
|---|---|
| 1 | 2,500 |
| 2 | 2,500 |
| 3 | 2,500 |
| 4 | 2,500 |
but instead of placing the prison in one district, the county places it in all the districts. See this simplified map:
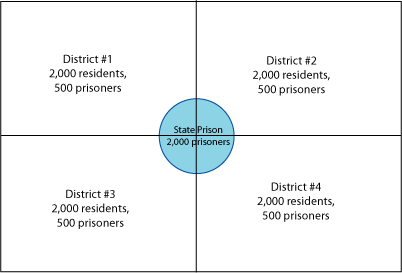
Dividing up the prison can be a lot of work for the county -- particularly when the prison is not conveniently located in the center of the county -- but it is the functional equivalent of taking the prisoners out of the districts.
Recommended Reading:
About the Prison Policy Initiative
Learn more about the organization behind the Prison Gerrymandering Project.

The Racial Geography of Mass Incarceration
The transfer of Black and Latino incarcerated people to communities very different than their own is a nationwide problem.

How to get elected without being a candidate first.
Iowa Public Radio explores how Anamosa Iowa ended prison gerrymandering.
