Our online tools can show the race and ethnicity of any given incarcerated population in three simple steps.
by Peter Wagner,
October 25, 2012
Demographers working on voting rights issues frequently examine proposed election districts to ensure that the plans won’t dilute the political power of minority voters. One of the things they look for is the problem of false majority-minority districts.
From the Prison Policy Initiative and Dēmos report, Preventing Prison-Based Gerrymandering In Redistricting: What To Watch For (en español):
Sometimes, a district that seems to have a majority-minority population really doesn’t, because of prison-based gerrymandering. If the minority “population” of the district consists of large number of incarcerated persons – who can’t vote – the district population numbers may be distorted. This creates districts that appear to give minorities the ability to elect the candidate of their choice, but in reality, they cannot. You need to examine any majority-minority district that includes a prison, to ensure that the district really has enough voting-eligible persons of color to create a viable majority with the ability to elect a candidate of choice to office.
Example: In order to settle a Voting Rights Act lawsuit, Somerset County Maryland intended to draw a district where African-Americans could elect a candidate of their choice after the 1990 and 2000 Censuses. But the inclusion of a large prison in the 1st Commission District split the sizable African-American resident voting population between two districts, leaving neither district able to elect a candidate of the African-American community’s choice. While the 1st Commission District appeared to be majority-African-American, in reality the district was not able to function as intended, because many of the purported African-American “residents” of the district were actually behind bars.
 Most demographers who do this work know how to spot a prison in the population data, but they might not know we developed a very simple way to determine the race and ethnicity of any given incarcerated population in three simple steps:
- Go to our Correctional Facility Locator.
- Enter the county or state you are interested in the search box.
- Find the facility you are interested in by block number. (We’ve likely already annotated it with the name of the facility for you.) Then click on the link marked “detail.“
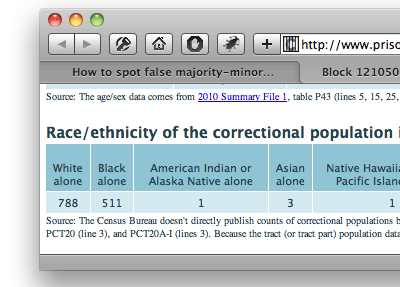
At the bottom of the “detail” page you’ll see a table with race and ethnicity for just the correctional population in that block. We are able to provide this data for every block with a correctional facility in the country except for two in Hawaii and two in New York. For all the others, we provide a unique footnote below the table describing which census tables were used to produce useful race and ethnicity data for the correctional population in that block.
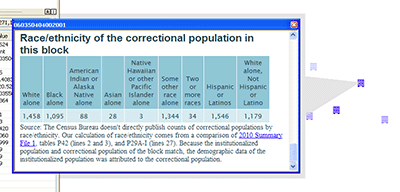
And if you are a GIS user, you can do this in just one click. By using our shapefile, you can access these detail pages right from the info pane of your Maptitude or Arcview software.
Nancy Scola makes a compelling case for prioritizing prison-based gerrymandering on the national agenda.
by Leah Sakala,
October 23, 2012
Nancy Scola makes a compelling case for prioritizing prison-based gerrymandering on the national agenda in her new American Prospect piece, “Making Prisoners Count.” She writes:
In an era obsessed with political data—Microtargeting! Swing-state polling! Data.gov!—and in a country where we incarcerate people at a higher rate than anywhere else in the world, thinking through the political counting of prisoners calls for the same enthusiasm, because the way we do it now corrupts the very equations upon which representative democracy is built.
Nancy goes on to explain how the Census Bureau’s practice of counting incarcerated people at prison locations unfairly boosts representation in communities with prisons, drains political power from communities that experience disproportionate incarceration rates, and creates perverse criminal justice policy incentives by giving elected officials a vested interest in expanding the prison industrial complex.
She concludes by observing that this issue is more pressing now than ever:
How the U.S. counts its prisoners might be a historical data quirk, but with the U.S. prison population now counted by the millions, it’s a quirk that skews how representative democracy operates.
Wondering how the Census Bureau’s prison count skews your vote? Check out our research results about your state or local government. Then take action and join us in solving the problem.
Candidates are urging city residents to exercise their democracy, but will the city take action to prevent prison-based gerrymandering?
by Leah Sakala,
October 23, 2012
The Florida city of Ocala got some national attention last week when vice presidential candidate Paul Ryan made a campaign stop in the downtown square on Thursday. But the question of who to vote for on November 6th isn’t the only democracy issue that Ocala residents are currently facing. As I write, the city is working on upholding the “one person, one vote” principle by redrawing the four city council districts to equally distribute the city’s population among them.
But Ocala’s redistricting process is plagued by one major flaw: the city is relying on census data that includes the 1,674 people in the Marion County Jail.
Because the city did not adjust the census data to ignore the jail count, both of the plans that are currently under consideration have lines that are skewed by the jail population.
Fortunately, the city of Ocala has not yet completed the redistricting process, so there’s still time to save local democracy from being skewed by the Census Bureau’s correctional counts. The solution is simple: remove the incarcerated population from the census data used to draw the new districts. If Ocala chooses to implement this solution, it will be in good company; more than 175 other local governments around the country chose to adjust the Census Bureau’s data to avoid prison-based gerrymandering.
How Ocala chooses to deal with this problem is an especially big concern for city residents. But all across the nation, cities and counties that contain correctional facilities face the same problem of how to deal with census data that does not accurately reflect actual communities. So, as we comb over ballot initiative proposals and peruse candidates’ positions this election season, it behooves us to take a step back and consider how the consequences of the Census Bureau’s correctional facility count may be undermining our democratic rights and responsibilities.
We've updated our model bills to end prison-based gerrymandering and shared them with past legislative sponsors.
by Peter Wagner,
October 10, 2012
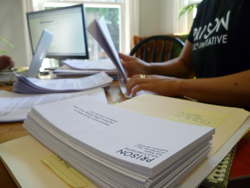
Leah Sakala sending out updated model legislation to previous sponsors of bills to end prison-based gerrymandering.
In consultation with our allies in the voting rights and criminal justice movements, we’ve updated our model bills to end prison-based gerrymandering and shared them with past legislative sponsors.
We’ve updated our principal state legislative bill that requires incarcerated people be counted at home for redistricting purposes. The improvements are all clarifications based on lessons learned during the successful implementation of similar legislation in Maryland and New York.
We’ve also generated a model bill that offers a critical interim step without going so far as to commit a state to count incarcerated people at home during the next redistricting cycle. This bill, the Model Incarcerated Population Data Collection Act, would simply require the Department of Corrections to begin collecting home address information for the incarcerated individuals under state jurisdiction now. The data could be used for various purposes, including reentry planning, criminal justice research, or most importantly, redistricting if the U.S. Census Bureau or an additional state decides to count incarcerated people at home for redistricting purposes in the future.
The Madison City Council has everything it needs to prevent the correctional facility from distorting the new city district lines.
by Leah Sakala,
October 1, 2012
Will the the City of Madison, Indiana follow in Terre Haute’s footsteps to avoid prison-based gerrymandering?
The Madison Courier recently reported that Madison City redistricting is underway, and one of the questions facing City Council members is how to handle the state prison population at the Madison Correctional Facility. If the city uses unadjusted Census Bureau data as the basis for the new district lines, more than a quarter of one of the districts will be made up of the prison population. Counting incarcerated people as if they were residents of the prison location contradicts both Indiana state law’s definition of residence and common sense. Failing to adjust the census data would give every three people in the district with the prison as much political clout as four people in any other district, just because of where they happen to live.
Fortunately, as the residents of Terre Haute know, there is a simple solution: take the prison population out of the census data that is used to draw the new districts. The Census Bureau publishes special tables for that express purpose, and more than 150 local governments around the country, including Terre Haute, use this solution.
The Madison City Council has everything it needs to prevent the correctional facility from distorting the new city district lines. Now, it’s time for the Council to act.
by Aleks Kajstura,
September 14, 2012
The governor of California just signed a bill (AB 1986) into law that improves California’s historic law ending prison based gerrymandering.
The LA Times has some coverage of the new bill along with some of the other bills signed.
Campaign stops bring candidates through cities and counties that struggle with prison-based gerrymandering in many different ways. State legislation sends a clear signal to local governments to end the pernicious practice.
by Leah Sakala,
September 13, 2012
Everyone seems to have elections on the brain as November 6th grows nearer, and the candidates are jetting around the country on the campaign trail trying hard to address the issues that concern the American people. But one electoral issue has been conspicuously absent from the candidates’ discourse: prison-based gerrymandering.
Because prison-based gerrymandering is a systemic problem that stems from a combination of antiquated Census Bureau policy and the rise of mass incarceration, the harmful effects can be found throughout the country. And although many struggles with prison-based gerrymandering don’t gain public attention, the candidates’ campaign stops reflect a wide range of approaches that state and local governments use to address the issue. The contrast between two recent presidential campaign stops — the cities of Hobbs, New Mexico and Golden, Colorado— highlight the critical role that state legislation plays in fixing the problem.
Mitt Romney recently stopped in Hobbs, New Mexico, where city officials redrew the six City Commission districts last year in order to balance the population in each districts. But although the district populations looked even upon local officials’ careful analysis, every four District 5 voters ended up with as much political clout as a group of five voters in every other district. Why? Because the districts are based on unadjusted Census Bureau data, which included the more than 1,000 people confined in the Lea County Correctional Facility located in District 5.
In Golden, Colorado, on the other hand, where President Obama made a campaign stop earlier today, the presence of a large correctional facility doesn’t compromise any resident’s access to local government. This is because the city proactively excluded the incarcerated population from the data they used to redistrict. If they had not, every group of three residents that live near the prison would have had as much political clout as a group of four residents in any other district.
While both Hobbs and Golden were technically and legally able to fix the problem of prison-based gerrymandering, Golden had one major benefit that Hobbs did not: state legislation that sends a clear message that the problem must be addressed. Colorado law requires counties to draw fair districts by excluding the prison populations and basing their population adjustments on the actual county residents. With this strong precedent from the state legislature, Colorado cities that contain large prisons have followed suit.
So, one thing that the people of the United State need to consider as we follow the candidates around the county is: how are prison populations impacting our right to equal access to government? There’s a growing number of states that are taking a stand by passing legislation to abolish prison-based gerrymandering in both state and local governments. How many more states will step up the plate and join that trend during the next presidential term?
Once again, ten California counties with large prison populations avoided prison-based gerrymandering when redrawing their board of supervisors' districts.
by Hillary Fenton and Aleks Kajstura,
September 13, 2012
Last year, California became the 4th state to pass legislation ending prison-based gerrymandering for state legislative redistricting. Unlike the Maryland and New York laws, which apply to state legislative, county and municipal redistricting, the California law applies only to state legislative redistricting. But even though the law doesn’t extend to local governments, many are taking action on their own.
As part of my summer law clerkship with the Prison Policy Initiative, I set out to determine how California counties with large prisons have traditionally addressed the problem of prison-based gerrymandering.
I discovered that the same ten counties that the Prison Policy Initiative identified as having avoided prison-based gerrymandering after the 2000 Census did so again after the 2010 Census. These are the 10 counties with the proportionally largest prison populations, so engaging in prison-based gerrymandering would have created the largest distortions of representation.
When I was determining which California counties avoided prison-based gerrymandering, for the most part I had to analyze redistricting maps and data to calculate whether the prison populations were included or excluded in the district populations. However, I came across four counties that, in their redistricting documentation, were explicit in their removal of prison populations to prevent prison-based gerrymandering.
For example, the Imperial County redistricting committee declared in a report that they decided to leave out the prison population early on in the redistricting process. In support of their decision, the committee pointed out that many California counties choose to exclude and also cited a 1991 California Attorney General opinion supporting their decision.
Similarly, the counties of Del Norte, Monterey, and Kings were also explicit in avoiding prison-based gerrymandering. In Del Norte County, the county clerk’s analysis of 2010 Census population information for the redistricting committee showed that the incarcerated population was subtracted from the “net population for redistricting purposes.” In Monterey County, the citizen’s redistricting committee expressed their decision to exclude prisoners in a report to the county supervisory board. And in Kings County, the supervisory district map published on the county website states that the given populations do not include the county’s incarcerated population.
Other counties that excluded the prison populations to avoid prison-based gerrymandering were Lassen County, Amador County, Tuolumne County, Madera County, Kern County, and San Luis Obispo County.
I found four counties, each with proportionately smaller prison populations than the counties discussed above, that included the prison populations when drawing districts and therefore diluted the votes of all county residents who do not live next to the prison. These counties were Solano County, Marin County, Modoc County, and Santa Barbara County.
Three of those counties have proportionally small prison populations compared to the population of individual districts, and the vote enhancement from prison-based gerrymandering ranged from 4% to 10%.
Including the prison populations in redistricting data had the highest impact in Solano County, where District 4 was drawn to contain the 8,649 people incarcerated at the 4 largest correctional facilities in the county. So the Solano County Board of Supervisors gave the actual residents of District 4 11% more influence than people in other county supervisor districts.
Solano County is of note because the county actually discussed avoiding prison-based gerrymandering. Citing an absence of guidance from the state, the Board of Supervisors chose to include the prison populations because that is what they had done in past decades.
Solano struggled with the issue of counting prison populations in April of 2011. Then six months later, the state passed a law to count incarcerated people at home for the purposes of drawing state legislative districts. With a clear trend in the State to move away from using prison populations to distort districts, Solano now has compelling guidance to make the right choice in 2021.
New map shows the growing national movement to reject the Census Bureau's prison miscount and to end prison-based gerrymandering.
by Peter Wagner,
August 27, 2012
We’ve produced a new map showing the strong and growing national consensus that prison-based gerrymandering must end:
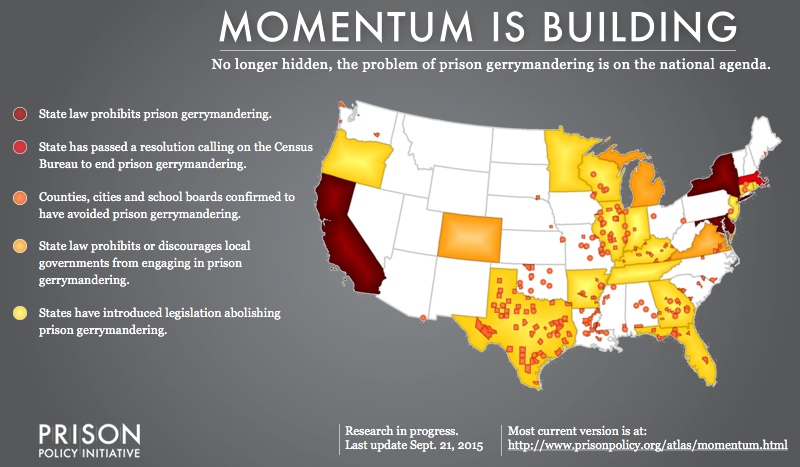
For more information about individual places on the map, see our campaign pages for California, Connecticut, Delaware, Illinois, Massachusetts, Maryland, Minnesota, New Jersey, New York, Rhode Island, Oregon and Wisconsin and our legislation page for additional information on previous legislation in Arkansas, Florida, Georgia, Kentucky, Indiana and Texas. Also see our articles about the laws in Michigan, Colorado and Virginia that require or encourage local governments to avoid prison-based gerrymandering.
As of today, we know of 143 individual county and municipal governments known to have excluded prison populations when redistricting.
The copy of this map at http://www.prisonpolicy.org/atlas/momentum.html will be updated as new bills are introduced and passed and as our research confirms additional counties and municipalities that avoided prison-based gerrymandering.
by Aleks Kajstura,
August 23, 2012
California’s historic law ending prison-based gerrymandering is about to get even better. The California Senate just passed a bill (AB 1986), that improves California’s law ending prison based gerrymandering.
Last summer, AB 420 (now Section 21003 of the Elections Code) presented a uniform state-wide solution to California’s problem of prison-based gerrymandering, making California the fourth state to end the practice. AB 420 prepared the State to count incarcerated people at home for redistricting purposes after the 2020 Census, and AB 1986 will make improvements to the law based on New York and Maryland’s implementation of their laws ending prison-based gerrymandering.
AB 1986 extends AB 420 to apply to prison populations in federal prisons. (AB 420 only provided for the collection of home addresses of people incarcerated in state prisons.)
AB 1986 also increases the precision in the required data. Currently the redistricting data is only requested to be adjusted by zip code, but the new bill expressly references Census blocks, which are the smallest geographic unit used by the Census Bureau. Switching to Census blocks creates more precision while also creating greater compatibility with the Census Bureau’s redistricting data sets.
Lastly, AB 1986 puts greater privacy protections in place. It requests that the Commission not publish the home addresses of incarcerated people, but only the final population data aggregated to Census blocks.
AB 1986, like AB 420, does not affect the distribution of state or federal funds. For more details, see the full bill analysis available from the Assembly Committee on Elections and Redistricting. AB 1986 is now headed to the Governor to be signed into law!


