Census prison quirk dilutes democracy in Idaho
by Peter Wagner, December 6, 2004
Like most states, Idaho relies on U.S. Census data to draw its legislative districts. Districts are redrawn each decade so that each districts is of equal size. Having equal numbers of people in each legislative district ensures that each person in that district has an equal access to government. This concept is known as the “One Person One Vote” rule, but it breaks down when the U.S. Census data does not reflect the actual population of the state.
By Idaho statute, when a person is incarcerated his or her residence remains where he or she lived prior to incarceration:
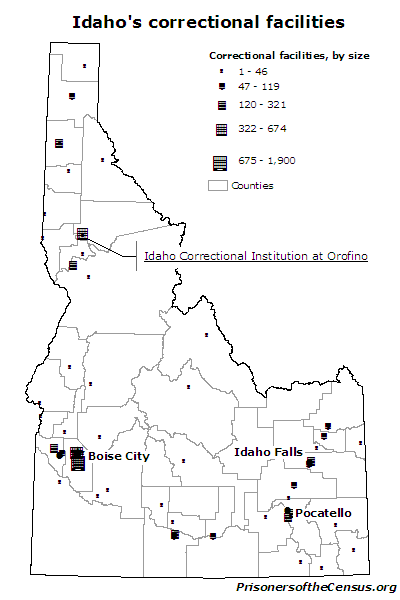
Almost 6% of Clearwater County’s Census population is incarcerated. It’s not the most punitive county in the state; it just happens to have a small population and the large Idaho Correctional Institution at Orofino filled with residents from other parts of Idaho.
“no person shall be deemed to have gained or lost a residence … while kept in any state institution at public expense.” Idaho Code § 34-405 (2003)
Yet, the Census Bureau, following its “usual residence rule” — first developed in 1790 long before state redistricting was envisioned — counts the incarcerated as residents of the town that contains the prisons rather than of their home communities.
This can radically change how the Census Bureau portrays certain Idaho communities. For example, almost 6% of the population reported in the Census for Clearwater County consists of prisoners counted at the Idaho Correctional Institution at Orofino.
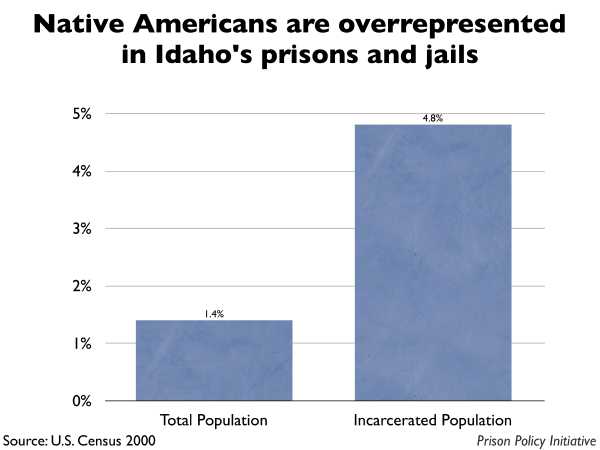
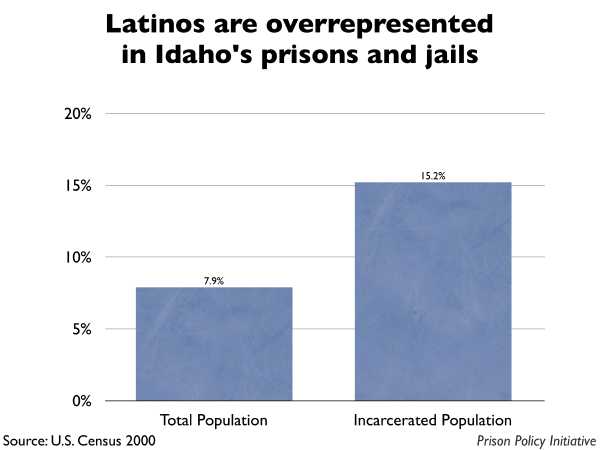
Prisoners are not allowed to vote in Idaho, but the presence of disenfranchised prisoners in the Census counts of prison towns swells the population and political power of those districts at the expense of the prisoner’s home communities. This issue should be of particular concern to the Native American and Latino communities who are overrepresented in the Idaho prison system.
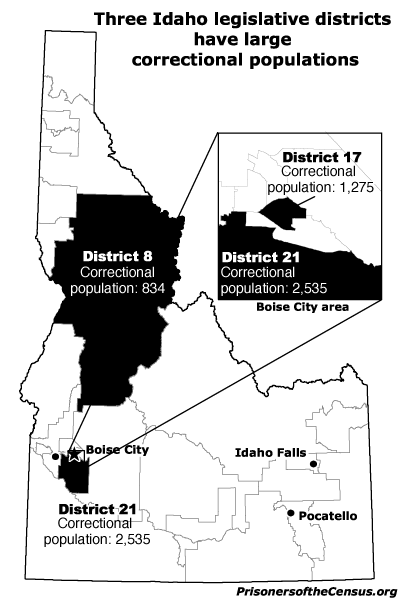
According to my analysis of Idaho legislative districts, 3 districts are at least 2% incarcerated prisoners. In one district, 6.9% of the district’s Census population is behind bars. In these districts, a sizable portion of the district is from somewhere else, making a vote by a real resident of that district more powerful than a vote elsewhere in the state.
Although Idaho does not publish where the people in its prisons and jails come from, it would seem safe to assume that the majority of the prisoners come from the 32 other districts in the state that do not contain large prisons.
Making the very conservative assumption that a full quarter of the prisoners counted as a part of District 21 reside near the prison when not incarcerated, 5% of the Census population in that district would actually be residents of other districts. This would mean that the votes of 95 people in District 21 would be equated with the votes of 100 people in other parts of the state.
Equating 95% with 100% is likely not what the Idaho legislature thought it was saying when it accepted the Census Bureau’s data and used it to draw its legislative districts. But the fact remains that as long as the Census Bureau counts incarcerated people as residents of the place that hosts the facility, and as long as state don’t first correct the data prior to redistricting, states will end up diluting the weight of a vote in every part of their state that does not have a large prison.
This is precisely the situation the One Person One Vote rule was designed to correct.
Data table
| District | Senator (2004) | Representatives (2004) | Incarcerated population | Ideal population | Percent of district incarcerated |
|---|---|---|---|---|---|
| 8 | Sen. R. Skipper “Skip” Brandt (R) | Rep. Ken A. Roberts (R) and Rep. Charles D. Cuddy (D) | 834 | 36,970 | 2.3% |
| 17 | Sen. Elliot Werk (D) | Rep. Kathie Garrett (R) and Rep. Janet J. Miller (R) | 1,275 | 36,970 | 3.4% |
| 21 | Sen. Jack Noble (R) | Rep. William T. “Bill” Sali (R) and Rep. Clifford R. Bayer (R) | 2,535 | 36,970 | 6.9% |


