Importing Constituents: Prisoners and Political Clout in Illinois
By Brett Blank and Peter Wagner
February 1, 2010
I. Introduction
The Census Bureau counts Illinois prisoners as if they were residents of the communities where they are incarcerated, even though they can’t vote and remain legal residents of the places they lived prior to incarceration. As Census data is used to apportion political power at all levels of government, crediting thousands of disproportionately urban and minority men to the wrong place has staggering implications for modern American democracy.
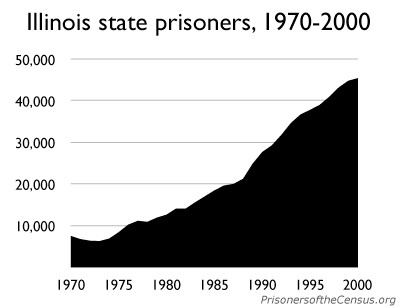
Figure 1. The number of state prisoners in Illinois grew from 7,326 in 1970 to 45,281 in 2000. (Source: Department of Corrections)
Illinois’ reliance on flawed Census data is responsible for a large shift in political clout from the Chicago area to downstate regions and a significant distortion of power within counties that contain prisons. Cook County (containing Chicago) is the home for 60% of Illinois’ prisoners even though over 90% of Illinois’ prisoners are incarcerated downstate.[1] Every prison built since 1941 is more than 100 miles away from Chicago; their average distance is more than twice that figure. This reduces Chicago’s population while simultaneously inflating the population of the rural communities where these prisons are located.
The Census Bureau has always counted prisoners as residents of the prison location, but it is only recently that the population in prison is large enough to effect legislative districting. In the last 3 decades of the millennium, the Illinois state prison population grew 6 times larger.[2] Counting prisoners as residents of the facility might have made sense in the country’s first century, when the mandate of the Census was limited to determining the relative populations of states for purposes of congressional representation. But today, state legislatures and county boards use the Census to apportion internal political power. Except for how it counts people in prison, in almost every respect the Census Bureau’s methodology has evolved to keep pace with a changing country and the changing needs for its data. To keep up with a changing nation and protect the integrity of representative democracy, the Census Bureau’s methodology must again evolve.
When state and county legislators use Census counts of prisoners to pad out the population of legislative districts that contain prisons, they violate the basic principle of republican democracy that everyone must be counted and represented in the right place. Illinois law is clear that a prison is not a residence, but the reliance by state and some local governments on flawed Census counts creates a big problem for democracy. This report will trace the impact of the Census Bureau’s prison miscount on state and local government, and highlight the actions of some rural counties that have rejected the flawed counts and drawn fair districts of actual population.
II. Illinois Law is Clear - Incarceration Does Not Change Residence
The general legal rule is that residence is the place where people choose to live permanently until they decide to go somewhere else. Old residences are not abandoned until there is an intent to make a new residence permanent.[3] In this way, for example, short stays in hotels do not invalidate a residence because the person intends to return home.
Incarceration, which is by definition involuntary and from which a prisoner intends to leave the moment he is able, cannot therefore be a residence. The unique facts of County of Franklin v. County of Henry, an Illinois state court case from 1887, take this obvious point and make it explicit: “a person confined in prison under the judgment and sentence of a court does not thereby change his residence.”[4]
In that case, James Smith had been employed as a farm laborer for one week in Henry County in September 1867. He was then arrested for rape, convicted, and sentenced to prison in Joliet Correctional Center. At some point prior to the completion of his sentence, he became insane and was transferred to a mental hospital in Jacksonville and then to a different mental hospital in Anna. Fifteen years after his conviction, he was released and transferred to the poorhouse of Franklin County under the mistaken belief that he was a resident of that county.
The law at the time required counties to pay for the costs of keeping their residents in poorhouses, so a lawsuit between Franklin and Henry counties over who was financially responsible went to the state appellate courts. In noting that: “James Smith has been either in jail, in the penitentiary, in an insane hospital, or in a poor house since the time he was arrested for crime in Henry County in September, 1867” the court held that “[i]t is plain that he has neither lost nor gained a residence since that date.”[5]
Although James Smith spent only 1 week working in Henry County, the decision to work there did more to establish his residence than the 15 years he spent in prisons and mental hospitals as a ward of the state. Before his incarceration, the last place that he chose to be was Henry County and that is where he remained a legal resident.
However, the Census Bureau does not count people at their legal residence. Instead, they are counted at their “usual residence” which the Bureau defines as the place “where the person lives and sleeps most of the time.” For most people, this is the same as their legal residence, but prisoners are a notable exception with significant implications for the statistical portrait of rural communities and the entire redistricting process.
III. Counting Incarcerated People as Residents of Prison Towns Skews Demographic Data.
Counting incarcerated people as if they were residents of prison towns leads to misleading portrayals of such communities. Prison communities tend to be small enough that incarcerated populations are a significant portion of the total “residents” counted by the Census. In our national research, we found 21 counties where at least 21% of the population reported in the Census was incarcerated.[6] Two of these, Brown and Johnson Counties, are in Illinois.
Because Blacks in Illinois are incarcerated 7.5 times as frequently as Whites[7] , where incarcerated people are counted has tremendous implications for how Black populations are reflected in the Census. For this reason, the African-American subcommittee of the Census Bureau’s Race and Ethnicity Advisory Committee recommended that the Census Bureau count prisoners as residents of their pre-incarceration addresses.[8]
Although Illinois’ prisoners are disproportionately Black, they are disproportionately incarcerated in White counties: 95% of the state and federal prison cells are located in disproportionately White counties. In 20 of Illinois’ 102 counties, more than half of the Black population reported in the Census as local residents are in fact incarcerated people from elsewhere in the state.[9] Table 1 summarizes the 10 counties in Illinois with the highest percentage of their Black census population incarcerated.
| County | Population | Black Population | Prison Popula-tion | Black Prison Population | Percentage of County Population Incarcerated | Percentage of Black Population Incarcerated |
|---|---|---|---|---|---|---|
| Brown | 6,950 | 1,265 | 1,912 | 1,260 | 27.5% | 99.6% |
| Johnson | 12,878 | 1,825 | 2,640 | 1,789 | 20.5% | 98.0% |
| Fayette | 21,802 | 1,064 | 1,437 | 1,018 | 6.6% | 95.7% |
| Pike | 17,384 | 260 | 390 | 247 | 2.2% | 95.0% |
| Montgomery | 30,652 | 1,143 | 1,989 | 1,039 | 6.5% | 90.9% |
| Fulton | 38,250 | 1,378 | 1,947 | 1,249 | 5.1% | 90.6% |
| Hardin | 4,800 | 132 | 153 | 117 | 3.2% | 88.6% |
| Greene | 14,761 | 110 | 153 | 96 | 1.0% | 87.3% |
| Crawford | 20,452 | 927 | 1,221 | 785 | 6.0% | 84.7% |
| Christian | 35,372 | 758 | 1,194 | 641 | 3.4% | 84.6% |
While the Census Bureau’s practice of counting prisoners as residents of the prison location complicates using the Census for demographic analysis of rural communities, the miscount creates, as will be seen in the next section, even more damage to democracy.
IV. Redistricting and “One Person, One Vote”
The basic principle of American representative democracy is that every vote must be of equal weight. When governments draw districts with equal populations, they ensure that each resident has equal access to government, no matter where she or he lives. When districts are of substantially different sizes, the weight of each vote starts to differ: in underpopulated districts, each vote is worth more, and in overpopulated districts, a vote is worth less.
By Illinois law, prisoners can’t vote and are considered legal residents of their pre-incarceration addresses. But by using Census Bureau counts of prison populations to pad out some legislative districts, lawmakers inflate the votes of residents who live near prisons at the expense of everyone else.
The U.S. Supreme Court first declared that the “One Person, One Vote” principle applied to state legislative redistricting in the 1963 landmark case Reynolds v. Sims.[10] The Court struck down an apportionment scheme for the Alabama state legislature that was based on counties and not population. Under Alabama’s apportionment plan, sparsely populated Lowndes County had the same number of state senators as densely populated Jefferson County. This gave the residents of Lowndes County 41 times as much political power as the residents of Jefferson County. Reynolds v. Sims barred this practice and put it plainly: “The weight of a citizen’s vote cannot be made to depend on where he lives.” The Supreme Court ruled that the 14th Amendment’s equal protection clause required that districts be drawn to be substantially equal in population.
Although the U.S. Supreme Court has allowed small differences in district sizes as long as the districts are substantially equal, Illinois is one of only two states to prioritize absolute population equality in state legislative districts.[11] Relying on Census data that counts tens of thousands of prisoners in the wrong place undermines this significant attempt to give all residents the same access to government.
IV. A. Diluting Votes in the State Legislature
In Illinois, a State Assembly district is supposed to contain 105,248 people, and — according to the Census — each district is that size. But the legislature relied on Census data which counted people in prison in the wrong place.
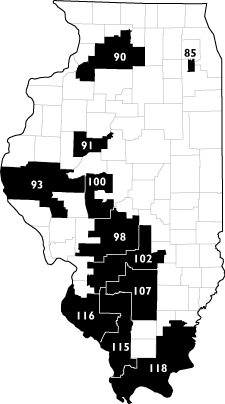
For example, the 91st House District, represented by Michael K. Smith (D), contains 3,576 prisoners - more than any other Illinois House district. Thus, of the 105,248 residents of the district, 3.1% are barred by law from voting for or against Representative Smith. As a result, every 97 legal residents of the district have the same power as 100 in a district without prisoners. As seen in Figure 2, there are 11 districts where at least 2% of each district’s population is incarcerated.
| District | Representative | Party | State and Federal Prison Population | % of District Incarcerated |
|---|---|---|---|---|
| 91 | Michael K. Smith | (D) | 3,576 | 3.4% |
| 107 | John D. Cavaletto | (R) | 3,495 | 3.3% |
| 118 | Brandon W. Phelps | (D) | 3,261 | 3.1% |
| 116 | Dan Reitz | (D) | 3,193 | 3.0% |
| 98 | Betsy Hannig | (D) | 3,183 | 3.0% |
| 102 | Ron Stephens | (R) | 3,048 | 2.9% |
| 85 | Emily McAsey | (D) | 2,691 | 2.6% |
| 100 | Rich Brauer | (R) | 2,366 | 2.3% |
| 115 | Mike Bost | (R) | 2,224 | 2.1% |
| 90 | Jerry L. Mitchell | (R) | 2,200 | 2.1% |
| 93 | Jil Tracy | (R) | 2,062 | 2.0% |
Further, crediting large urban non-voting populations to remote prison districts has a focused and negative impact on the political strength of Black residents at the state level. 65% of the state’s prisoners are Black[12] , but 95% of the state’s prison cells are located in House districts that are disproportionately White.
Illinois’s prison population is disproportionately urban in origin. For example, only 23% of Illinois lives in Chicago, but the city is home to 60% of the state’s prison population.[13] Available data does not allow us to determine exactly which legislative districts people in prison come from, nonetheless is clear that much of the prison population should have been credited to disproportionately urban and Black communities within Illinois’ cities.
Instead, this population was credited to districts like Illinois House District 91 near Fulton County, where 86% of the Black population is powerless to vote for or against the representative because they are incarcerated and barred from the polls. Without the 2,060 Black prisoners at the Illinois River Correctional Center and Federal Correctional Institute at Pekin, District 91 would be the second Whitest district in the Illinois House.
Illinois’ decision to rely on flawed Census counts of the prison population artificially enhances the representation afforded to predominantly White districts with prisons and waters down the voting power of everyone else. Without counting disenfranchised prisoners as part of their population base, eleven legislative districts are substantially short of their ideal population. At the same time, heavily minority urban districts would in all likelihood be entitled to additional representation if prisoners were counted as residents of their home communities for purposes of redistricting.
IV.B. Diluting Votes on the Local Level
The Census Bureau’s prison miscount has an even more pronounced impact on fair districting in local legislatures, such as county boards. Because the district sizes tend to be relatively small, a single prison can have a significant impact. The most dramatic example is in Lee County with four districts of about 9,000 people. However, when drawing the district lines, the county included the 2,200 people incarcerated at the Dixon Correctional Center in district 4. Almost 25% of district 4 is people who are not residents of the county and — even if they could vote — would not be allowed to participate in local elections. Consequently, 75 voters in this district have the same voting power as 100 voters in the other districts.
| Districts in Counties that include prisoners | Percent district population is incarcerated |
|---|---|
| Lee Dist. 4 | 24.7% |
| Clinton Dist. 1 | 21.4% |
| Vermilion Dist. 9 | 19.9% |
| Rock Island Dist. 24 | 18.2% |
| Will Dist. 8 | 4.9% |
| Will Dist. 9 | 2.1% |
We found a total of 6 county districts in 5 counties where prison populations were used to pad out county districts. See Table 3.
| Bond |
| Christian |
| Crawford |
| Fayette |
| Fulton |
| Knox |
| LaSalle |
| Livingston |
| Logan |
| Montgomery |
Fortunately, counties are not powerless. We found that most Illinois counties with large prisons protected the integrity of their local democracy by rejecting the Census Bureau’s prisoner count when drawing their districts. Ten counties ignored the prison population when drawing local districts: Bond, Christian, Crawford, Fayette, Fulton, Knox, LaSalle, Livingston, Logan, and Montgomery. Many of these counties reported that because the prisoners cannot vote and will leave once they complete their sentences, there is no reason to distort democracy by including them in redistricting plans. Similarly, three cities: Galesburg, Canton, and Vandalia also rejected the idea of using prison populations to pad city council districts.
Illinois courts have explicitly upheld the exclusion of prisoners from a county’s apportionment base.[14] In Knox County Democratic Committee, the Illinois Appellate Court upheld the County Board’s decision to exclude prisoners after the 1990 Census, noting that:
“[h]ad the Board adopted the plaintiffs’ position and automatically included an extra 1,248 ineligible voters in a single district, there would have been substantially fewer eligible voters in that district when compared to the other four districts. Thus, the eligible voters in that district would have possessed a disproportionate share of voting power. Accordingly, the Board excluded the non-voting inmates when constructing the districts.”[15]
V. Recommendations
The Census Bureau’s decision to credit thousands of disenfranchised non-residents to the Census blocks with prisons creates serious problems for Illinois. When state and county legislators use Census counts of prisoners to pad out the population of certain legislative districts where they do not reside, the basic democratic principle that everyone must be counted and represented in the right place is violated.
Prison-based gerrymandering need not exist in the future, as the state can fix the actual data or lobby the Census Bureau for change. Bond, Christian, Crawford, Fayette, Fulton, Knox, LaSalle, Livingston, Logan, and Montgomery counties have the right idea. They rejected U.S. Census data that, if uncorrected, would seriously distort their democracy. These counties agree that some residents should not dominate government affairs just because they live next to a prison.
The Census Bureau needs to change its outdated method of counting people in prison, and state and local officials should encourage that change. In the mean time, state and county governments should be planning to fix the Census Bureau’s mistakes.
V.A. The Census Bureau should change how it counts people in prison.
The ideal place to fix the prisoner miscount is at the U.S. Census Bureau. Historically, the bureau has been responsive to the needs of its data users when deciding how to count the population, so Illinois state and local officials should lobby the Bureau directly. Further, they can endorse the recent letter sent by New York State Senator Eric Schneiderman and St. Lawrence County, New York, Legislator Tedra Cobb asking that the Census Bureau change how it counts prisoners. The letter asks the Census Bureau to count prisoners as residents of addresses outside of the facility, and if insufficient time remains before the 2010 Census to implement that change, that the Bureau implement as an interim solution -- as recommended by the National Research Council -- publication of a special version of the PL 94-171 redistricting data file for the prison population. Such detailed block-level counts of prison populations would assist the state and its counties in identifying and removing the prison populations prior to redistricting.
The Illinois Constitution requires the General Assembly to draw new districts during the 3 short months that follow the release of the Census Bureau’s PL 94-171 redistricting data. This short timetable makes one interim solution — waiting for Summary File 1 and deleting the prisoners prior to redistricting — impossible. Illinois is therefore particularly dependent upon the Census and needs a reliable version of this data. Unless the Census Bureau is willing to make changes in how it counts prisoners and publishes its data, the state will have to begin preparations now to modify the Census Bureau’s data.
V.B. Illinois should adjust the US Census’ count of prisoners prior to redistricting.
While the U.S. Supreme Court requires states to draw new districts each decade on the basis of population, states are not required to use the Census.[16] Illinois’ decision to rely on flawed Census data that credits prisoners to the wrong part of the state undermines the significant effort the state made to draw equal districts. Illinois can fix the Census data by creating a special state-level census that collects the home addresses of people in prison and then adjusts the U.S. Census counts prior to redistricting. Kansas currently uses a similar procedure to adjust the federal census counts of students and the military.[17] “Prisoner Census Adjustment Act” legislation has been introduced in New York[18] and Michigan.[19] Representative Arthur Turner (D-Chicago) introduced a similar bill in earlier sessions of the Illinois House. The constitutionality of the Illinois bill was reviewed in the Law Review article “Counted out Twice — Power, Representation & the ‘Usual Residence Rule’ in the Enumeration of Prisoners: A State-based Approach to Correcting Flawed Census Data,” by recently graduated Northwestern University School of Law student David Hamsher. Hamsher’s article provides the legal foundation necessary for legislators to support state-based solutions to federal failures. The bill did not advance in that session, but it received an endorsement by Mayor Richard Daley.[20]
V.C. Counties with prisons should subtract prisoners from population data when drawing legislative districts.
The majority of Illinois counties with large prisons ignored the prison populations when drawing county board districts and all counties in Illinois should follow suit. The five counties of Lee, Clinton, Vermilion, Rock Island, and Will should redraw their districts in a similar fashion by excluding prisoners.
If the Census Bureau and the state of Illinois both fail to act to change how prisoners are counted in the next Census, all counties should be sure to exclude prisoners prior to redistricting to prevent harm from being done to their local democracies.
Of particular concern is Jefferson County, not discussed above because the large Big Muddy River Correctional Center was built after the districts were last updated. If Jefferson County was to draw new districts today, including the prison population would result in drawing a district that was almost three quarters prisoners. Giving residents 4 times as much political power as others just because they happen to live next to a big state prison blatantly contradicts the principle that legislators should represent residents, not buildings.
The lessons are clear. Modern American democracy requires more than the Census Bureau’s data currently delivers. If the Census Bureau doesn’t provide better data, the users of that data will need to take matters into their own hands.
VI. Methodology
This report uses the correctional facility populations as counted by the Census Bureau and published in Summary File 1, Table P37. Our analysis is based on a subset of this data, filtered to include only state or federal prisoners and not people in jail, halfway houses, etc. Our filtering methodology is documented in Section 2 of the Democracy Toolkit (2007).[21] The Census does not publish race and ethnicity for the group quarters population at the tract level, so we exported our data to Arcview 9.2, where we manually deduced the race and ethnicity of each facility’s population from tract-level data made available in tables PCT17B and PCT17H. In the few cases where this was insufficient, we accessed race and ethnicity data for the individual blocks which were then attributed to the correctional facility.
Our calculations in the Introduction about where Illinois’ prisoners come from and where they are incarcerated focuses only on state facilities, we were unable to get information about where prisoners in federal custody originate. However, our analysis of the prisoner miscount’s impact on the legislative process includes the federal prisons because these populations affected the legislative districts in the same way.
We excluded local jails from our analysis of legislative districts and county statistics because jail inmates are allowed to vote and because they are frequently incarcerated in their home counties. We considered the Tri County Detention Justice Center run by GWI Corporation in Pulaski County as a local jail because the majority of its population is local jail inmates from Pulaski and neighboring counties.
Not included in our analysis of legislative districts or county statistics are the Kankakee Minimum Security Unit and the Joliet Adult Transitional Center as we were unable to find these facilities in the Census data. It is possible that the Census Bureau missed these facilities, or the Census Bureau classified the facilities as something other than a correctional facility and counted the facilities in the wrong place. But as we were unable to positively identify where these facilities were counted, if they were counted at all, they are not included in our analysis of legislative districts and county statistics.
The impact on individual state districts and counties was calculated in ArcView 9.2 based on shapefiles distributed by the Census Bureau and the Illinois Board of Elections.
Our analysis of the impact on county districts follows the methodology in the Democracy Toolkit to determine whether prison populations were excluded from districts and to calculate the resulting vote dilution in counties that included them. Most counties did not publish the population totals for their districts, so we calculated the population totals by overlaying Census data over the county district maps in Arcview. In the counties that publish electronic files with the shapes of their districts, this calculation was straightforward. In other counties, we recreated their paper maps in Arcview and then calculated the population totals using both official Census data and a special version of the Census data with the prison populations removed.
About the Authors
Brett Blank was a law clerk at the Prison Policy Initiative in 2007 and a 2009 graduate of the Western New England College School of Law.
Peter Wagner is an attorney and Executive Director of the Prison Policy Initiative. In 2002, he authored the first district-by-district analysis of the impact of Census counts of prisoners on state legislative redistricting in Importing Constituents: Prisoners and Political Clout in New York (2002). He has presented his research at national and international conferences and meetings, including a Census Bureau Symposium, a meeting of the National Academies, and keynote addresses at Harvard and Brown Universities. His publications include, with Rose Heyer, Too Big to Ignore: How Counting People in Prisons Distorted Census 2000 (2004), with Eric Lotke, Prisoners of the Census: Electoral and Financial Consequences of Counting Prisoners Where They Go, Not Where They Come From (2005), and with Meghan Rudy, Ellie Happel, and Will Goldberg, Phantom Constituents in the Empire State: How Outdated Census Bureau Methodology Burdens New York Counties (2007.)
Acknowledgements
This research was supported by a grant from The After Prison Initiative of the Open Society Institute. We thank Shaena Fazal and Malcolm Young for their feedback on earlier drafts of this report, Yugo Nakai for starting the county research, and Chris Sturr, William Goldberg and Elena Lavarreda for their assistance improving the text.
About the Prison Policy Initiative
The Massachusetts-based non-profit, non-partisan Prison Policy Initiative documents the impact of mass incarceration on the larger society. Focusing on a once-obscure Census Bureau glitch that counts people in prison where they are temporarily held instead of the communities they come from; the Prison Policy Initiative demonstrates how the prison system reaches beyond prisons to punish people and communities not under criminal justice system control. The organization’s work to change how people in prison are counted has won the support of the New York Times editorial board and the Census Bureau’s own advisors at the National Research Council.
Footnotes
[1] Downstate Illinois is all of Illinois except for Cook and the Collar Counties (Lake, McHenry, Kane, Will, and DuPage.)
[2] Illinois Department of Corrections, Statistical Presentation 2001 (visited Aug 21, 2007)
[3] See ex rel Madigan v. Baumgartner, 823 N.E.2d 1144, 1150 (2005) (stating that to change a residence “there must be, both in fact and intention, an abandonment of the former residence and a new domicile acquired by actual residence, coupled with the intention to make it a permanent home”).
[4] County of Franklin v. County of Henry County, 26 Ill.App. 193 (Ill.App. 2 Dist. 1887)
[5] Id.
[6] Rose Heyer and Peter Wagner, Too big to ignore: How counting people in prisons distorted Census 2000, April 2004, Prison Policy Initiative.
[7] Prison Policy Initiative, Racial Disparities in Illinois, 2001 and drawing data from Bureau of Justice Statistics, Prison and Jail Inmates at Midyear 2001.
[8] Recommendation 10 of the Census Advisory Committee on the African American Population Made As a Result of Meeting on October 1-3, 2003
[9] See Appendix D, Incarcerated populations in Illinois counties.
[10] Reynolds v. Sims, 377 US 533 (1964).
[11] The other is California. National Conference of State Legislatures, Redistricting 2000 Population Deviation File (visited Aug. 16, 2007)
[12] Illinois Department of Corrections Data: June 30, 2000 [PDF].
[13] Id.
[14] Knox County Democratic Committee v. Knox County Board, 597 N.E.2d 238 (Ill.App. 3 Dist. 1992)
[15] Id. at 240.
[16] In Bethel Park v. Stans, 449 F. 2d 575 (C.A. 3, 1971) the city of Philadelphia and a Pennsylvania congressman sued the Census Bureau for counting military personnel, students and prisoners at their temporary addresses instead of their home addresses, because the plaintiffs feared a loss of representation. The court stated that “Although a state is entitled to the number of representatives in the House of Representatives as determined by the federal census, it is not required to use these census figures as a basis for apportioning its own legislature.” Bethel Park v. Stans, 449 F. 2d 575, 583 (C.A. 3, 1971). Two years later, when faced with a similar issue, the Supreme Court rejected Virginia’s argument that it was compelled to use the Census Bureau’s assignment of residences to military personnel when drawing state legislative districts. Mahan v. Howell, 410 U.S. 315, 331 (1973).
[17] In Kansas, “[s]enatorial and representative districts shall be reapportioned upon the basis of the population of the state adjusted: (1) To exclude nonresident military personnel stationed within the state and nonresident students attending colleges and universities within the state; and (2) to include military personnel stationed within the state who are residents of the state and students attending colleges and universities within the state who are residents of the state in the district of their permanent residence.” KS CONST. Art. 10 S1.
[18] New York Senate Bill 1633 includes a specific provision that would apply the Census adjustment not only to Senate and Assembly districts but to county districts as well.
[19] Michigan House Bill 4395 was introduced by Reps. Lemmons, Young, and Gonzalez on June 19, 2007.
[20] Mayoral Caucus on Prisoner Reentry, Rebuilding Lives. Restoring Hope. Strengthening Communities [PDF] (Visited Aug. 16, 2007) .
[21] Peter Wagner, Democracy Toolkit (visited Aug. 16, 2007).
Recommended Reading:
About the Prison Policy Initiative
Learn more about the organization behind the Prison Gerrymandering Project.

The Racial Geography of Mass Incarceration
The transfer of Black and Latino incarcerated people to communities very different than their own is a nationwide problem.

How to get elected without being a candidate first.
Iowa Public Radio explores how Anamosa Iowa ended prison gerrymandering.

Events
- July 1, 2026:
On July 1, 2026 at 1 p.m. EST, join the Prison Policy Initiative and guests Jodi Hocking, Executive Director of Return Strong Nevada, and Taj Mahon-Haft PhD, Director of The Humanization Project, as they discuss the importance of family connections, highlight the ways they are under attack, and share strategies to help families fight back.
Register here
Not near you?
Invite us to your city, college or organization.