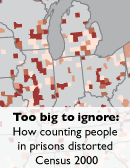
Too big to ignore:
How counting people in prisons distorted Census 2000
By Rose Heyer and Peter Wagner
Prison Policy Initiative
April 2004
Section:
Too Big To Ignore interactive tables
Your search found 254 results.
| County | State | Percent of county Census population in prison | Percent of county Census Black population in prison | Percent of county Census Latino population in prison |
|---|---|---|---|---|
| Brazos (more info available) |
Texas | 1.20% | 4.23% | 1.76% |
| Brewster | Texas | 0.45% | 0.00% | 0.78% |
| Briscoe | Texas | 0.00% | 0.00% | 0.00% |
| Brooks | Texas | 0.11% | 0.00% | 0.12% |
| Brown (more info available) |
Texas | 1.53% | 10.74% | 2.12% |
| Burleson | Texas | 0.22% | 0.85% | 0.08% |
| Burnet (more info available) |
Texas | 1.53% | 29.48% | 2.46% |
| Caldwell (more info available) |
Texas | 3.55% | 17.04% | 2.47% |
| Calhoun | Texas | 0.17% | 0.37% | 0.25% |
| Callahan | Texas | 0.08% | 3.45% | 0.00% |
| Cameron | Texas | 0.38% | 1.36% | 0.41% |
| Camp | Texas | 0.21% | 0.54% | 0.06% |
| Carson | Texas | 0.28% | 7.89% | 0.66% |
| Cass | Texas | 0.23% | 0.52% | 0.00% |
| Castro | Texas | 0.13% | 0.53% | 0.19% |
| Chambers | Texas | 0.40% | 1.65% | 0.53% |
| Cherokee (more info available) |
Texas | 3.13% | 11.13% | 3.24% |
| Childress (more info available) |
Texas | 21.70% | 69.62% | 31.58% |
| Clay | Texas | 0.23% | 4.35% | 0.25% |
| Cochran | Texas | 0.11% | 0.59% | 0.18% |
Showing results 21 to 40 of 254.
Recommended Reading:
About the Prison Policy Initiative
Learn more about the organization behind the Prison Gerrymandering Project.

The Racial Geography of Mass Incarceration
The transfer of Black and Latino incarcerated people to communities very different than their own is a nationwide problem.

Are legislative maps hurting prison reforms?
Pam Adams explains how in her downstate Illinois column.

Do prisons draw in Census money for their host communities? No.
We explain that prison gerrymandering is bad for democracy but federal & state aid are not impacted.