by Peter Wagner,
March 29, 2004
By official Census numbers, small population deviations between Arizona districts
On March 1, 2004, the Arizona Independent Redistricting Commission released the new maps for the state legislature. The maps are currently open to public comment and will be presented to the Court and the Justice Department for approval in April.
The Commission did a relatively good job of keeping district size deviations to a minimum. (See first map at right.) Ensuring that districts are of equal size is how each resident is guaranteed equal representation under the “one person one vote” principle.
Updating district boundaries after each Census is important so that the districts can reflect the new population. This is doubly important in Arizona, the second fastest growing state in the country. Arizona was 40% larger in 2000 than it was in 1990.
But the Arizona Redistricting Commission failed to account for an even faster growing population: prisoners. The population of state, local, federal and private prisons and jails more than doubled from 1990 to 2000. On Census Day 2000, the U.S. Census counted 45,783 people in correctional facilities in Arizona and assigned each of these individuals to the prison’s address.
Continue reading →
by Peter Wagner,
March 22, 2004
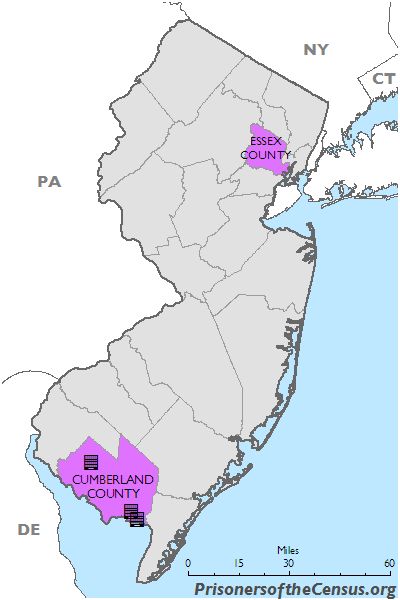
Eighteen percent of New Jersey’s prisoners are from Essex County which includes Newark. Thirty percent of the state’s prisoners are incarcerated in Cumberland County far to the south.
Essex County (which includes the city of Newark) sends more residents to prison than any other county in New Jersey. Essex County is home for 18% of New Jersey’s prisoners, but only 9.4% of the state’s population. With only 11% of the state’s prison cells located in Essex County, many prisoners are incarcerated outside the county.
The U.S. Census counts prisoners not at their homes but as if the prisoners were residents of the prison town. This changes county populations and skews their demographics.
[The situation in Camden County is similar. Camden County has 6% of the New Jersey’s population but supplies 14% of the state’s prisoners. Only 5% of the state’s prisoners are are incarcerated in Camden County.]
Rural Cumberland County is 120 miles to the south of Newark on Delaware Bay. Only 2% of New Jersey’s prisoners call Cumberland County home, but almost 30% of the state’s prisoners are incarcerated in three large prisons in the county. This shift in the population affects how much representation each of these counties receives in the legislature. But attempts by policy makers to examine the needs of these counties is complicated by the impact of prisoners on other statistics.
Continue reading →
by Peter Wagner,
March 15, 2004
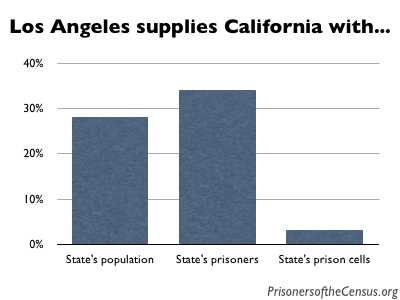
Los Angeles County is 28% of the state of California, but it supplies 34% of the state’s prisoners. The political effect of this disproportionate incarceration is magnified by the fact that the Census Bureau counts prisoners where they are incarcerated, not where they are from. Few prisoners are incarcerated in Los Angeles County — the county contains only 3% of the California’s state prison cells.
The situation is reversed in prison-hosting regions like Kings County, a 3 hour drive to the north. Kings County’s reported population of 129,461 is greatly inflated by the inclusion as local residents of 17,262 state prisoners. This small county has 0.89% of California’s land mass and 0.33% of California’s non-incarcerated residents, yet it contains 12% of the state’s prisoners.
In order to accurately reflect our communities, the Census Bureau should update its methodology to count prisoners where they voluntarily reside: at home.
by Peter Wagner,
March 15, 2004
We’ve written two new articles that explain how redistricting works. The first is a theoretical introduction to the topic and the second explains how the transfer of prisoners can change the outcome of elections on the border between different regions of the state.
Redistricting Matters: Small changes in the boundary lines mean huge electoral effects uses some simple illustrations to illustrate why redistricting matters.
Hanging in the balance? is about New York State Senate district 34 which straddles the border of NYC’s Bronx county and Westchester county in such a way as to use Bronx residents to create a Westchester district.
by Peter Wagner,
March 8, 2004
PrisonersoftheCensus.org argues that prisoners are a part of the community where they originated and not the prison-hosting community. Home is where their social, political and cultural ties are. But do legislators look at it the same way?
Taren Stinebrickner-Kauffman decided to find out:
“… I sent to all members of the lower house of the Indiana state legislature a brief survey that included the following question:
“Which inmate would you feel was more truly a part of your constituency?
“a) An inmate who is currently incarcerated in a prison located in your district, but has no other ties to your district.
“b) An inmate who is currently incarcerated in a prison in another district, but who lived in your district before being convicted and/or whose family still lives in your district.
“Every single one of the forty respondents who answered the question – regardless of their political party or the presence or absence of a prison in their district – chose answer (b). Had the responses been more ambiguous there might have been reason to repeat the survey with other groups of legislators. However, unless there is something highly anomalous about Indiana, it is quite clear that representatives do not consider inmates to be constituents of the districts in which they are incarcerated – unless, of course, they happen to have prior ties to those districts.”
Since everybody agrees that prisoners should be represented at home, the Census should count prisoners in the same place — at home.
Source: Counting Matters: Prison inmates, population bases, and “one person, one vote”, by Taren Stinebrickner-Kauffman 11 Va. J. Soc. Pol’y & L. 229, 303. (Winter 2004)
by Peter Wagner,
March 8, 2004
David Sommerstein has a great piece on North Country Public Radio Prisoners: North Country Residents?. The piece was aired on March 5, the morning of Peter Wagner’s presentation at the Census Bureau symposium and discusses our Feb 16 Fact of the Week contrasting Franklin County’s exclusion of the prisoner population with St. Lawrence County’s decision to include the prison population to shore up underpopulated Republican districts in the county legislature.
You can listen to the program at the above link, or read a transcript we created.
by Peter Wagner,
March 1, 2004
Unlike college students, prisoners are not a part of the local community. While some colleges are partially self-reliant communities, prisons are entirely so. Students are welcome and encouraged to come in to town to purchase goods and services and to rent apartments. Students can register to vote in the local community and may decide to stay permanently after graduation.
Prisoners are barred from leaving the facility without official permission. Forty-eight states bar prisoners from voting, and those that allow prisoners to vote require the voting to be done via absentee ballot back home. Finally, parole regulations frequently require prisoners to be returned to their original county of conviction upon release.
While students are a part of the host community, prisoners are not.
For more information on how students are counted, see our new FAQ (Frequently Asked Questions) section.