Can you help us continue the fight? Thank you.
—Peter Wagner, Executive DirectorDonate
Importing Constituents: Prisoners and Political Clout in Montana
By Peter Wagner
December 14, 2004
The Census Bureau counts prisoners not at their homes but as if they were residents of the town that contained the prison. This administrative quirk reduces the population of the communities where most prisoners originate and swells the population of the rural communities that house prisons. Montana now incarcerates more than 4 times as many people as it did in 1980, making what would once be a trivial issue into a critical one.[1]
When the Census began in 1790, demographics-based planning and redistricting did not yet exist. The Census' sole constitutional mandate was and is to count the number of people in each state to determine their relative populations for purposes of Congressional reapportionment. It didn't matter -- for purposes of comparing Montana' population to Idaho's -- whether an incarcerated person was counted at home in Billings or in the Montana State prison, as long as they were counted in Montana. Times have changed but Census methodology has not.
Counting incarcerated people in the prison town skews demographic data and makes it harder for states to plan policy
Counting incarcerated people as if they were residents of the prison town leads to misleading portrayals of which counties are growing and which are declining. Declining populations are often a sign of economic distress. Toole County, Montana is one of 56 counties in the country that the Census Bureau labeled as growing over the previous decade when in fact more people were choosing to move out of the county than were moving in to it.[2] The population growth of the Crossroad Correctional Center in Toole County masks the economic needs of this county.
How the incarcerated are counted in Montana is of critical importance to an accurate count of Native American communities. While Native Americans are 6% of the Montana population, more than 20% the incarcerated people in the state are Native American. (See Figure 1.) Native American women are the same 6% of Montana women, but are 32% of the incarcerated women in the state. Native Americans in Montana are incarcerated at a rate more than 4 times higher than the White residents of the state.[3]
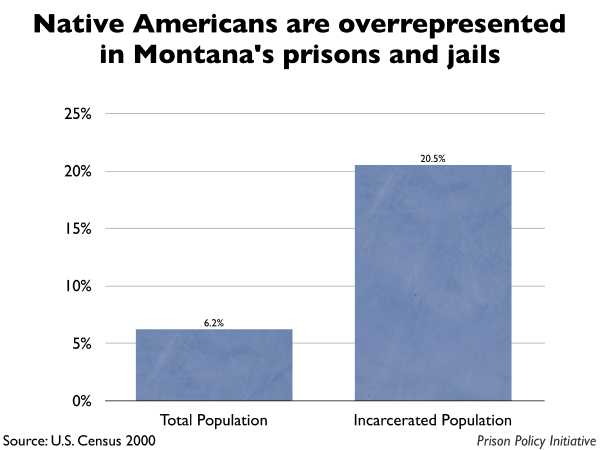
Figure 1. Incarceration in Montana disproportionately affects Native Americans. Source: U.S. Census 2000
These distortions are largest in Powell County, where almost 19% of the county's census population is in the Montana State Prison. Eighty-one percent of the Native American adults in Powell County are "residents" of the prison.[4]
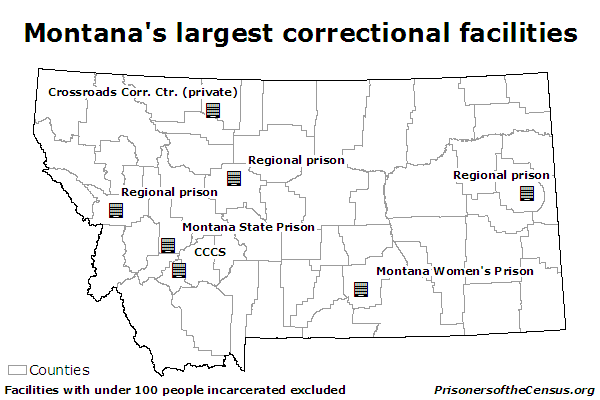
Map 1.Montana's correctional institutions are not evenly distributed in the state. The Montana State Prison is the largest prison in the state, with a population of 1,300 people in the Census.
Montana election law says that a prison is not a residence
The Montana election law statute, like that of most states, defines residence as the place that you willingly choose to be and explicitly states that a prison can not be a residence:
"§13-1-112 (2) An individual may not gain or lose a residence while kept involuntarily at any public institution, not necessarily at public expense; as a result of being confined in any prison."
The U.S. Census does not bother to determine where a prisoner's residence actually is, but to fairly draw state legislative boundaries, the state legislature is required to determine the true residence of its citizens.
As this report illustrates, the incarcerated population in Montana is now so large that it is no longer possible to ignore the fact that the Montana election law requires data different from that provided by the Census Bureau.
Redistricting and One Person One Vote
Montana, like most states, relies on Census Bureau data to redraw its state legislative boundaries so that each will contain the same number of people as required by the 14th Amendment's One Person One Vote rule. Equally sized districts ensure that each resident has an equal access to government regardless of where she or he lives. The Census counts everyone, including people who can't vote such as prisoners and children. Basing districts on the total population rather than voters makes sense for most groups. Children and non-citizens, for example, are at least a part of the surrounding community and share some common interests with it. Children can with some confidence rely on their neighboring adults to represent their interests. But prison communities are often very closely aligned with the prison industry and are likely to be quite dissimilar to the communities that the prisoners came from.
The basic principle of American representative democracy is that every vote must be of equal weight. The starting point for state legislative redistricting is the landmark 1963 Supreme Court case Reynolds v. Sims.[5] Reynolds struck down an apportionment scheme for the Alabama state legislature that was based on counties and not population:
"Legislators represent people, not trees or acres. Legislators are elected by voters, not farms or cities or economic interests."[6]
In 1960 Alabama, Lowndes County with 15,417 people had the same number of state senators as Jefferson County with 634,864 people. Believing the situation in Alabama to be illustrative of a large number of other states drawing legislative boundaries in such as way as to dilute the political power of citizens based on where they lived, the Supreme Court wrote a very broad opinion to guide the states in fairly apportioning both houses of the state legislatures.
If districts are of equal size, each citizen has equal access to a representative to advocate for her or his needs. When districts are of substantially different sizes, the weight of each vote starts to differ. In under-populated districts, each vote is worth more, and in overpopulated districts, a vote is worth less. In 1960 Alabama, a Lowndes County senator had the same political power as one from Jefferson County, but the Lowndes County senator could devote her or himself to advancing the interests of only 15,417 people. As a result, a vote in Lowndes county was worth over 41 times a vote in Jefferson county. Reynolds v. Sims barred this practice and put it plainly: "[T]he weight of a citizen's vote cannot be made to depend on where he lives."[7]
Every prisoner counted as a resident of the prison district decreases the number of "real" residents required for the prison district. As the number of real residents declines in a district, the weight of a vote in that district increases as compared to the residents elsewhere in the state. This undemocratic effect is magnified by the fact that most of the "phantom" residents of the prison districts should have been counted within very different legislative districts in other parts of the state.
So while prisoners are barred from voting for or against the legislator that "represents" them while they are incarcerated, Montana restores a prisoner's right to vote on the day that he or she is released. But that is also the same day that the former prisoner will be getting on a bus to leave the prison district and return back home.
Including disenfranchised non-resident prisoners as population for purposes of redistricting creates prison districts with substantially fewer constituents than elsewhere. The real residents of the prison district have more access to their legislator than other state residents.
In Montana, a House district is supposed to contain 9,022 people. But because of how the Census Bureau counts the incarcerated population, the drafters of legislative districts should not assume that everyone is a resident of the place where they are counted. District 85, in Powell and Deer Lodge Counties, currently represented by Cynthia Hiner, is 14.5% prisoners. These disenfranchised prisoners are overwhelmingly from homes outside the district, meaning that the actual population of the district is very small. Every group of 85 residents in District 85 gets as much of a say over state affairs as 100 people in Missoula or Billings.
This is precisely the situation the One Person One Vote rule was designed to correct.
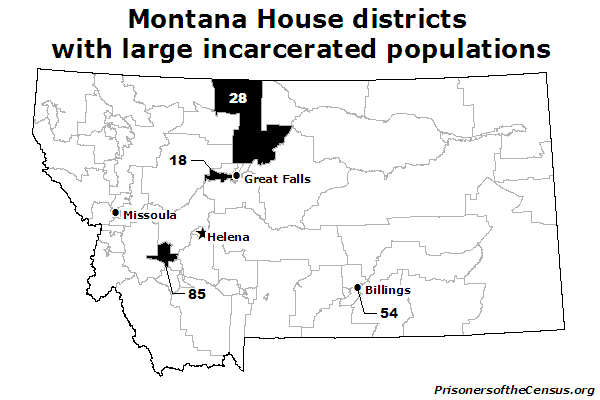
Map 2. Montana House District 85 is 14.5% prisoners from other parts of the state. This is the highest percentage of any state legislative district anywhere else in country yet discovered.
| House district number | Legislator | Location description | Number of people in correctional facilities counted in that district | Percent of district's population that consists of people in a correctional facility |
|---|---|---|---|---|
| 18 | Joe McKenney (R) | Cascade County | 309 | 3.42% |
| 28 | John E. Witt (R) | Chouteau, Liberty and Toole Counties | 336 | 3.72% |
| 54 | Gary Branae (D) | Yellowstone County | 332 | 3.68% |
| 85 | Cynthia Hiner (D) | Deer Lodge and Powell Counties | 1,308 | 14.50% |
Recommendations
Montana will not be redrawing its district lines again until after the 2010 Census, but planning for that Census is currently underway. If Montana wants to the Census Bureau's data to be compatible with how its election code defines residence for incarcerated people, it needs to make that fact known to the Census Bureau.
Historically, the Census Bureau has proven itself to be an agency very responsive to the needs of its data users. The method of counting other special populations has changed numerous times, in each case responding to changing demographics and needs in the country. When evolving demographics meant more college students studying far from home and more Americans living overseas, the Census policy changed in order to more accurately reflect how many Americans were living where. Today, the growth in the prisoner population requires the Census to update its methodology once again.
Endnotes
[1] Mother Jones Magazine, July 2001, Debt to Society: Montana, Increasing imprisonment.
[2] Rose Heyer and Peter Wagner, Too big to ignore: How counting people in prisons distorted Census 2000, April 2004 and the 56 counties fact of the week
[3] According to an analysis of US Census 2000 data, the White incarceration rate in Montana was 366 per 100,000, while the rate for Native Americans was 1,511 per 100,000.
[4] Powell County has 7,180 people in the Census, with 1,338 of that population being incarcerated. The Census reported 187 Native Americans in incarcerated in the county, and 22 Native American children in the county.
[5] Reynolds v. Sims 377 US 533 (1964)
[6] Reynolds at 562.
[7] Reynolds at 567.
Methodology
This report uses the total correctional populations (state, federal and military prisons, local jails, halfway houses, and "other correctional facilities") as counted and placed by U.S. Census 2000 and made available on the American Factfinder System. The impact on legislative districts was calculated by placing these correctional populations within the district shapefiles provided on the website of the Districting and Apportionment Commission of the Montana State Legislature. The average figure of 9,022 people per Montana house district was provided by the Redistricting 2000 Population Deviation Table of the National Conference of State Legislatures.
About the author
Peter Wagner is Assistant Director of the Prison Policy Initiative, an Open Society Institute Soros Justice Fellow, and a 2003 graduate of the Western New England College School of Law. Mr. Wagner is the author of Importing Constituents: Prisoners and Political Clout in New York (April, 2002), the first systematic state analysis of the impact of prisoner enumeration policies on legislative redistricting. He has spoken and testified at numerous national and state forums on this topic. Mr. Wagner edits PrisonersoftheCensus.org and writes a weekly fact column for the website about the varied impacts on society from miscounting prisoners.
His most recent publications are The Prison Index: Taking the Pulse of the Crime Control Industry (April 2004) and with Eric Lotke, "Prisoners of the Census: Electoral and Financial Consequences of Counting Prisoners Where They Go, Not Where They Come From" (forthcoming, Pace Law Review).
Acknowledgements
This research was supported by a grant from the Soros Justice Fellowship Program of the Open Society Institute. I thank Bill Cooper for suggesting Montana for this research, and Scott Crichton, Casey Rudd and Brigette Sarabi for reviewing early drafts of this report. Responsibility for any errors and the final conclusions rest solely with the author.
About the Prison Policy Initiative
The Prison Policy Initiative (PPI) conducts research and advocacy on incarceration policy. Its work starts with the idea that the racial, gender and economic disparities between the prison population and the larger society represent the grounds for a democratic catastrophe. PPI's concept of prison reform is based not only in opposition to a rising rate of incarceration, but in the search for a lasting solution to pressing social problems superior to temporarily warehousing our citizens in prisons and jails.
The Prison Policy Initiative is based in Northampton, Massachusetts. For more information about PPI or prison policy in general, visit http://www.prisonpolicy.org.
Recommended Reading:
About the Prison Policy Initiative
Learn more about the organization behind the Prison Gerrymandering Project.

The Racial Geography of Mass Incarceration
The transfer of Black and Latino incarcerated people to communities very different than their own is a nationwide problem.

How to get elected without being a candidate first.
Iowa Public Radio explores how Anamosa Iowa ended prison gerrymandering.

The Census Bureau's Miscount: It's about representation, not funding
We explain that prison gerrymandering is bad for democracy but federal & state aid are not impacted.