Importing Constituents: Prisoners and Political Clout in Minnesota
By Aleks Kajstura
March 10, 2010
Introduction
The Census Bureau counts Minnesota prisoners as if they are residents of the communities where they are incarcerated, even though they can’t vote and remain legal residents of the places they lived before they were incarcerated. American democracy relies on Census counts to apportion political power on the basis of equal population. Crediting thousands of urban and minority men to the wrong communities, has staggering implications for the future of American democracy; the process of drawing fair and equal legislative districts fails when the underlying data are flawed.
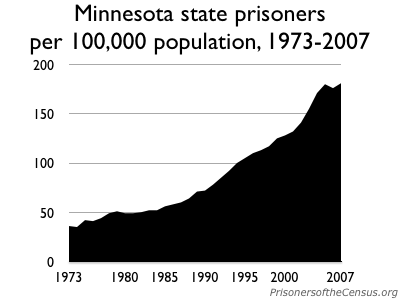 The Census Bureau has always counted prisoners as residents of the prison location, but it is only recently that the prison population is large enough to effect legislative districting. In the past 30 years, the rate of incarceration has risen dramatically, more than quadrupling, in Minnesota. In 1977 only 44 out of every 100,000 Minnesotans were incarcerated, by 2007, that rate jumped to 181 per 100,000.[1] As of July 1, 2009 there were over 9,000 people incarcerated in Minnesota. About 35.4% of those incarcerated are Black, compared to 4.6% of the general Minnesota population.[2] About 6.8% of people incarcerated in Minnesota are American Indian, compared to 1.2% of the general Minnesota population.[3] Because the prison population is growing faster than Minnesota as a whole, and because Minnesota’s prison system has one of the largest racial disparities in its prison system in the country, the need to for an accurate count of the prison population is even more urgent. There are now so many people behind bars in Minnesota that the question of where this population is counted is large enough to have a direct impact on democracy.
Today, our concept of democracy requires far more detailed and accurate data to reflect where the population — including people in prison — actually live. In almost every respect, except for how it counts people in prison, the Census Bureau’s methodology has evolved to keep pace with the changing needs for its data. But now that such a large percentage of the population is incarcerated, where the Census Bureau counts people in prison is a question of critical importance.
The Census Bureau is counting the large population of incarcerated people in the wrong place. A legal residence is the place that people choose to be and do not intend to leave; and because prison is not voluntary, it cannot be a residence. Indeed, Article VII, section 2 of the Minnesota Constitution states that “no person loses residence … while confined in any public prison.” When redistricting legislative districts, Minnesota should use data that are consistent with the state constitution and stop basing legislative districts on prison populations.
Redistricting and “One Person, One Vote”
To ensure that each resident has equal access to government, regardless of where she or he lives, each legislative district is drawn to contain the same population. When districts are of substantially different sizes, the weight of each vote starts to differ: in under populated districts, each vote is worth more, and in overpopulated districts, a vote is worth less.
By Minnesota law, prisoners can’t vote and remain residents of their home communities. But by relying on Census Bureau counts of prison populations, which pads out legislative districts with prisons, Minnesota is inflating the votes of residents who live near prisons at the expense of every other resident.
Based on the 2000 Census numbers, which Minnesota last used for redistricting, a State House of Representatives district is supposed to contain 36,713 people. Each district comes close to this ideal. Indeed, Minnesota’s House Districts are among the most equal in the country - only 3 other states have House Districts more equal in population.
Judging by the Census numbers, the least perfect Minnesota House District, District 10A, is only 289 people short. This imperfection is miniscule compared to the Census’s miscount of the incarcerated population. In nine House Districts, the problem of prison-based gerrymandering is three times larger than the biggest population inequality in Minnesota’s districts. In fact, without prisoners as padding, three districts are missing more than 3% of their required population.
| District | Counties | Current representatives (2010) | State/federal prison population | Notable correctional institutions in district |
|---|---|---|---|---|
| 56A | Washington | Julie Bunn (DFL) | 1746 | MCF Stillwater, MCF Oak Park Heights |
| 20A | Big Stone, Swift, Lac qui Parle, Yellow Medicine, Lincoln | Andrew Falk (DFL) | 1324 | Prairie Correctional Facility |
| 52A | Anoka, Washington | Bob Dettmer (R) | 1124 | MCF Lino Lakes |
| 26B | Rice, Steele | Patti Fritz (DFL) | 1097 | MCF Faribault |
| 26A | Waseca, Steele | Kory Kath (DFL) | 943 | FCI Waseca |
| 08A | Carlton, Pine and St. Louis | Bill Hilty (DFL) | 861 | MCF Willow River/Moose Lake |
| 08B | Kanabec, Isanti and Pine | Tim Faust (DFL) | 847 | FCI Sandstone |
| 30A | Olmsted | Tina Liebling (DFL) | 839 | FMC Rochester |
| 15B | Sherburne, Benton and Stearns | Larry Haws (DFL) | 800 | MCF St. Cloud |
| 06B | St. Louis | Mary Murphy (DFL) | 599 | FPC Duluth |
The narrow Census population variation between its districts makes it clear that Minnesota prioritizes the principle of equal representation, but the Census Bureau’s miscount of incarcerated people undermines the state’s attempts to draw equal districts. The systematic practice of counting incarcerated people in the wrong part of the state leads to an unequal, unfair, and undemocratic districts.
Recommendations
A. Minnesota can adjust the U.S. Census’ count of prisoners prior to redistricting to count incarcerated people at home.
Minnesota can fix the Census data by collecting the home addresses of people in prison and then adjusting the U.S. Census counts prior to redistricting. Legislation with these goals has been introduced in New York and Texas and is modeled after Kansas’ adjustment of federal census counts of military personnel and students.
This plan would require the state to determine which correctional populations it wishes to adjust the residence for and develop a plan to collect that information on Census day in April 2010. The state would have to process this data and prepare to subtract incarcerated people from the Census blocks that contain prisons and add them to their home blocks. States are not required to use Census data when drawing state and local districts. See, Borough of Bethel Park v. Stans, 449 F.2d 575, 583 n.4 (3rd Cir. 1971).
B. Minnesota can draw state and/or county districts without the prison populations.
Alternatively, states can ignore the prison populations when drawing their state district lines. This approach would not credit incarcerated people back to their homes, but it would end the practice of crediting them to different communities of interest in the wrong part of the state. It has been endorsed as a viable interim solution by the National Research Council of the National Academies, the editorial board of the New York Times, and a state constitutional amendment with this approach is currently pending in Wisconsin.
Mississippi, Colorado and New Jersey require counties with prisons to remove the prison population prior to redistricting, and Virginia law encourages it. About 100 counties around the country ignore the prison populations when drawing county districts.
C. Ask the Census Bureau to change where it counts people in prison.
The Census Bureau’s decision to credit thousands of disenfranchised non-residents to the Census blocks with prisons creates serious problems for Minnesota. When state and county legislators use Census counts of prisoners to pad out the population of certain legislative districts where they do not reside, the basic democratic principle that everyone must be counted and represented in the right place is violated.
The Census Bureau needs to change its outdated method of counting people in prison, and state and local officials should encourage that change for future Censuses. With time has run out before the 2010 Census, the state should explore ways that it can make up for the Census’ data shortcomings and help protect the integrity of the line drawing process at the state and local level. There are four ways the state can do this: by advocating for change at the Census Bureau, by changing where incarcerated people are counted in the redistricting data, by drawing all districts without the prison populations, and by requiring counties to draw districts without prison populations.
The ideal place to fix the prisoner miscount is at the U.S. Census Bureau. Historically, the bureau has been responsive to the needs of its data users when deciding how to count the population, so Minnesota state and local officials should lobby the Bureau directly. Change at the Census Bureau would eliminate any conflict between Census data and residence rules the Minnesota Constitution.
While insufficient time remains for the Census Bureau to change where incarcerated people are counted in 2010, Minnesota should start asking the Bureau to make the change in future Censuses. In the mean time, in order to protect its next round of redistricting, Minnesota must explore other options at the state level in order to protect the fairness of its redistricting process.
Methodology
This report uses the correctional facility populations as counted by the Census Bureau and published in Summary File 1, Table P37. Our analysis is based on a subset of these data, filtered to include only state or federal prisoners and not people in jail, halfway house residents, etc. Our filtering methodology is documented in Section 2 of The Democracy Toolkit (2007).
The Census does not publish race and ethnicity data for the group quarters population at the block level, so Appendix 2, "Race and incarcerated populations in Minnesota House districts" was produced with a slightly different methodology that also includes jails, halfway houses and other small correctional facilities. We used the Census 2000 State Legislative District Summary File and tables P1 (population) PCT17B (Group Quarters Population by Sex by Age by Group Quarters Type, Black Alone) and PCT17C (Group Quarters Population by Sex by Age by Group Quarters Type, American Indian/Alaskan Native Alone).
About the Author
Aleks Kajstura is an attorney and Legal Director of the Prison Policy Initiative. Volunteering since 2003, she helped develop the Prisoners of the Census project. Aleks was also the lead author of the report, The Geography of Punishment: How Huge Sentencing Enhancement Zones Harm Communities, Fail to Protect Children. After graduating from the Benjamin N. Cardozo School of Law in May 2008, Aleks assumed the position of President of the Prison Policy Initiative Board of Directors. In November 2009, after a clerkship at the Connecticut Superior Court, she joined the Prison Policy Initiative full-time, as legal director.
Acknowledgements
This research was supported by grants from the Public Welfare Foundation and The After Prison Initiative of the Open Society Institute. We thank Sarah Walker, Mark Haase, and Keesha Gaskins for their feedback on earlier drafts of this report.
About the Prison Policy Initiative
The Massachusetts-based non-profit, non-partisan Prison Policy Initiative documents the impact of mass incarceration on the larger society. Focusing on a once-obscure Census Bureau glitch that counts people in prison where they are temporarily held instead of the communities they come from; the Prison Policy Initiative demonstrates how the prison system reaches beyond prisons to punish people and communities not under criminal justice system control. The organization’s work to change how people in prison are counted has won the support of the New York Times editorial board and the Census Bureau’s own advisors at the National Research Council.
Footnotes
1 Bureau of Justice Statistics, "Sourcebook of Criminal Justice Statistics Online," table 6.29, available at http://www.albany.edu/sourcebook/pdf/t6292007.pdf and Bureau of Justice Statistics, "Sourcebook of Criminal Justice Statistics 1994," table 6.20, available at http://www.albany.edu/sourcebook/pdf/sb1994/sb1994-section6.pdf
2 Minnesota Department of Corrections, "Adult Inmate Profile," available at http://www.doc.state.mn.us/aboutdoc/stats/documents/07-09AdultProfile.pdf and U.S. Census Bureau, Minnesota "State & County QuickFacts," available at http://quickfacts.census.gov/qfd/states/27000.html
3 Minnesota Department of Corrections, "Adult Inmate Profile," available at http://www.doc.state.mn.us/aboutdoc/stats/documents/07-09AdultProfile.pdf and U.S. Census Bureau, Minnesota "State & County QuickFacts," available at http://quickfacts.census.gov/qfd/states/27000.html
Recommended Reading:
About the Prison Policy Initiative
Learn more about the organization behind the Prison Gerrymandering Project.

In prisons, Blacks and Latinos do the time while Whites get the jobs
We explore the racial disparity inside prisons.

McAlester, Okla. ends prison gerrymandering, Census Bureau can do better
McAlester, Okla., finally ended prison gerrymandering after a decade of trying. It's time for a national solution.

Prison-based gerrymandering's historical precedent
This is not the first time a policy barred people of color from the polls and transferred their political power to white voters.