Too big to ignore:
How counting people in prisons distorted Census 2000
By Rose Heyer and Peter Wagner
Prison Policy Initiative
April 2004
The Census Bureau counts people incarcerated in state and federal correctional facilities as if they were residents of the prison town. Although incarcerated people are not a part of the community with the prison, they become a part of the community's statistics. This problem has existed on a technical level since the first Census, but the combination of the expanding use of Census data and of the growth in incarceration makes the issue critical today.
When the Census began in 1790, demographics-based planning and redistricting did not yet exist. The Census' sole constitutional mandate was and is to count the number of people in each state to determine their relative populations for purposes of Congressional reapportionment. It didn't matter -- for purposes of comparing New York's population to New Jersey's -- whether an incarcerated person was counted at home in the Bronx or in prison in Attica, as long as they were counted in New York State. Times have changed but Census methodology has not.
Federal, state and local government use Census data to plan programs and distribute funds. Since the 1960s, states and local governments have been required to update their legislative districts each decade to comply with the "One person one vote principle". Congress now requires the Census Bureau to make its data readily useful to local governments for redistricting purposes[1], and in turn almost all state and local governments base their decennial redistricting on Census Bureau data.
As use of the Census data has evolved, so too has the American population. Until recently, Americans were incarcerated at a very low rate. Prisoners were rare in both absolute and percentage terms. (See Figure 1.) The 1990 Census was the first Census to see a sizable increase in the percentage of Americans in prison, and it was also the first Census to explicitly instruct citizens to not count incarcerated family members.[2]
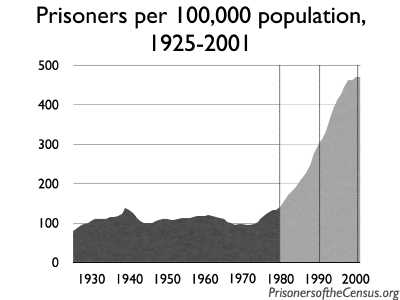
Figure 1. In the 1980 and prior Censuses, households were not explicitly told to exclude prisoners from their count. The 1980 Census was the last Census taken before incarceration rates began to skyrocket.
The impact on Census data is large because prisoners tend to be demographically different from the average population of the country, and because prisoners tend to be incarcerated in communities far removed from their homes.
Although few communities are "average", incarcerated people are far from the average demographic. Ninety-two percent of people incarcerated in federal and state prisons are men. Blacks and Latinos are only a quarter of the U.S., but are almost 63% of the nation's incarcerated. (See Figures 2 and 3.)
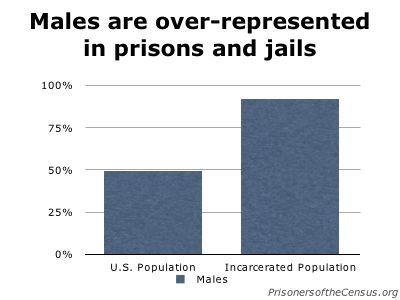
Figure 2.
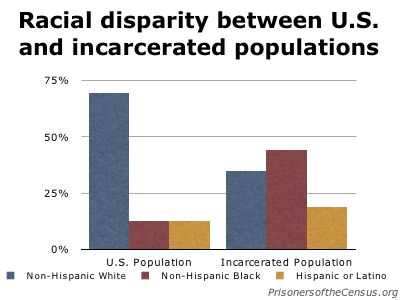
Figure 3.
Prisons tend to be distributed differently than the general population in a state. In New York, 25% of the state lives in the upstate rural and upstate urban areas. Ninety-one percent of the state's prisoners are incarcerated there, mostly in the upstate rural areas. (See Figure 4.)
Research into the geographic disparities of incarceration is ongoing, but a clear pattern is emerging:
- Sixty percent of Illinois' prisoners call Cook County (Chicago) home, yet 99% of the state's prison cells are outside the county.[3]
- Los Angeles County supplies 34% of California's prisoners, yet only 3% of the state's prisoners are incarcerated there.[4]
- Philadelphia is the legal residence for 40% of Pennsylvania's prisoners, but the County contains no state prisons.[5]
- Wayne County (Detroit) is home for 20% of Michigan's population. Almost 30% of the state's prisoners are from Wayne County, but only 11% of the state's cells are there.[6]
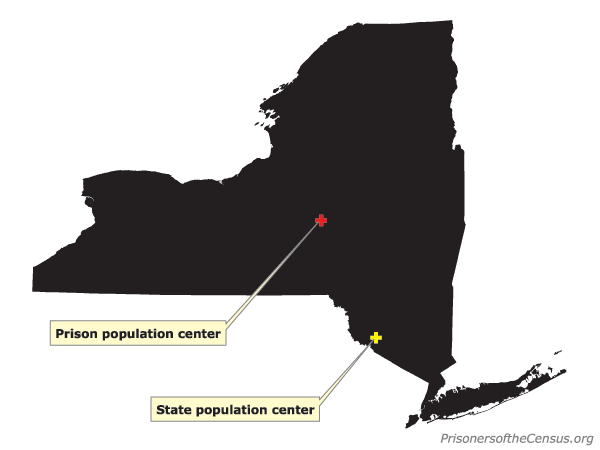
Figure 4. If everyone in New York State stood at their census address on a flat, weightless map of the state, the map would balance near Otisville in Sullivan County, just over the border from Orange. The population center for the 71,466 New York State prisoners, on the other hand, is near Hamilton in Madison County over 100 miles to the north and west.
Impact on county size
Counting large external populations of prisoners as local residents leads to misleading conclusions about the size and growth of communities. Many of the prison hosting counties have relatively small actual populations, but large prison populations. Twenty one counties in the United States have at least 21% of their population in prison. (See Figures 5, 6 and 7.)
The Census Bureau's 2002 estimates show that Ohio's troubled Mahoning County lost 4,250 residents since the Census. Yet almost half of that loss is explainable by the closure of a large private prison in Youngstown.[7]
Growth, too, may also be artificial. The Census Bureau's 2002 estimates reported that Brent, Alabama was the second fastest growing town in the state. The 900 men added to the existing facility accounted for the entire population growth in the town. Bibbs County, which contains Brent, was labeled the second fastest growing county in the state but its actual growth was negligible. In Alabama, 30 out of 67 counties are losing population, so a county that reports a growing population will appear to be more economically successful. The impact of prisoners propelling Brent from the middle to the top of the Alabama pack was not noted in the Census Bureau's data or in initial press coverage. The Birmingham News discovered the quirk because "a skeptical Birmingham News reader in Centreville alerted the newspaper to Brent's prison boom."[8]
Regional statistics are also subject to hidden distortion as Rolf Pendall of the Brookings Institution discovered. Upstate New York was one of the slowest growing regions in the country, growing only 1.1 percent from 1990 to 2000. But things were even worse than they appeared:
"Almost 30 percent of new residents who came to Upstate New York in the 1990s didn't make the trip by choice, and they didn't move into subdivisions or houses on secluded cul-de-sacs. They were inmates making their new homes in prison cells."[9]
Counting the incarcerated population can make counties with declining populations appear to be growing. Census 2000 reported that 78% of counties experienced population growth during the 1990s. Yet 56 of these counties can attribute their growth only to prison expansion and not to children being born or new residents choosing to move to the county. Said another way, for each 50 counties labeled by the Census as growing during the 1990s, one of those counties actually saw a decline in their actual free population. (See Figure 7.)
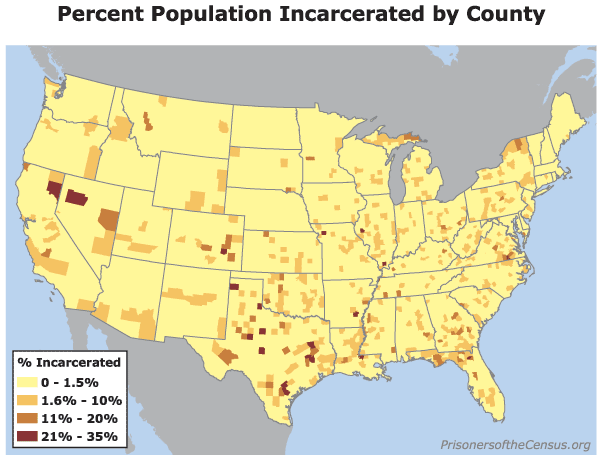
Figure 5. Many counties show a large percentage of their population consists of prisoners imported from elsewhere.
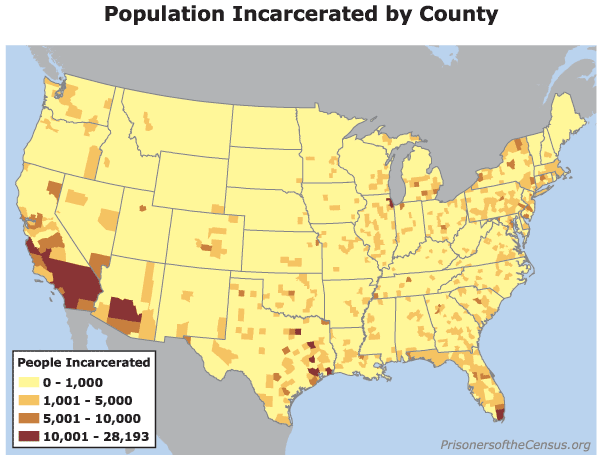
Figure 6. Many counties report large numbers of incarcerated residents. Outside of urban counties with large jails, these populations consist primarily of prisoners placed in the county by state or federal authorities.
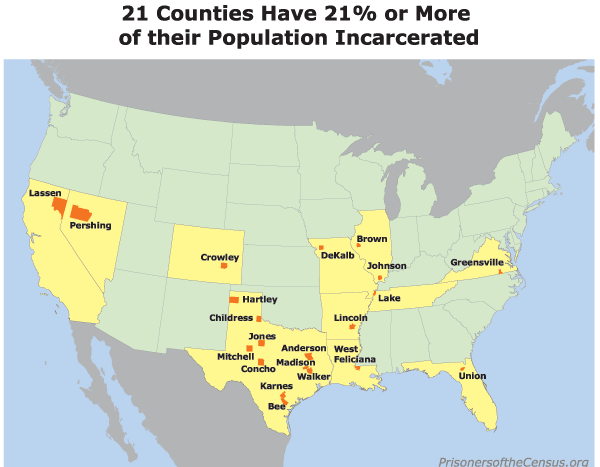
Figure 7.
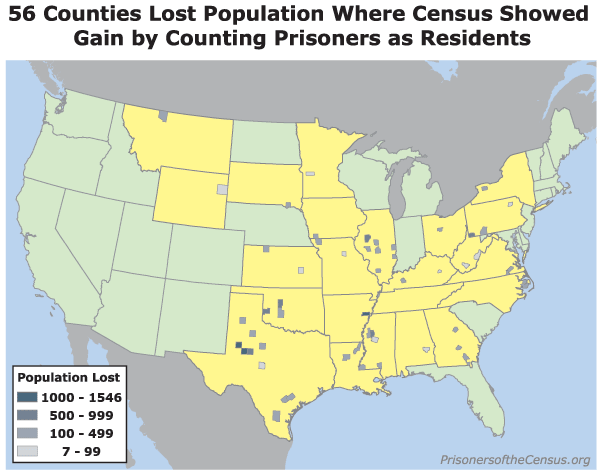
Figure 8. Census 2000 reported how many counties grew during the 1990s and how many declined. But if not for the construction of new prison cells, 56 counties labeled as growing would have reported declining populations.
Impact on race, ethnicity and age statistics
Because of the large racial disparity in incarceration, there can also be a subtle change in how the racial distribution of a state is portrayed in the Census. Census 2000 shows that predominantly White Franklin County New York more than doubled its Black population since 1990. That would be news to both the residents of the county and the prisoners, neither of whom consider the prisoners to be residents of Franklin County. Ninety-one percent of Franklin County's Black population is incarcerated in the county's 5 state prisons.
Nationally, many counties report that a quarter, half, or even more of their Black population is incarcerated. This does not necessarily reflect a bias in the county's criminal justice system; rather it reflects a geographic bias in how the Census counts incarcerated people as residents of the prison facility. Even when we exclude counties that have only small Black populations incarcerated, the number of these quirks remains significant enough to undermine the value of Census data. (See Figures 9 and 10.)
This frustrates attempts to examine the evolution and migration of Black demographics. One typical study is a map entitled "Percent Change 1990 to 2000, One Race: Black or African-American" in the Census Bureau's excellent "Mapping Census 2000: The Geography of U.S. Diversity". (See Figure 11.) The map attempts to illustrate the growth of the Black population of every county in the country, but the Census' enumeration of prisoners as local residents leads to misleading results. For example, Black Americans are not being drawn for jobs or retirement to rural Oregon, Nevada or Michigan. Rather, they are being sent to these regions against their will for temporary placement in a correctional facility. These growth statistics do not reflect the community's actual character.
A similar effect can be seen in Mapping Census 2000's illustration of the age distribution of Hispanics. (See Figure 13.) Nationally, 25.7% of people of all ethnicities are under the age of 18. This varies from place to place, in part because of where people of certain ages choose to live. For example, many older people move to Florida, so that state has a very low proportion of young people.[10] Nationally, Hispanics are a much younger population than the total U.S. population, as 35% are under the age of 18. Unfortunately, it is hard to tell whether there are any relevant age-based trends in Latino migration for economic or social reasons because the data is overwhelmed by the number of adult Latinos moved to counties against their will for purposes of incarceration. (See Figure 14.)
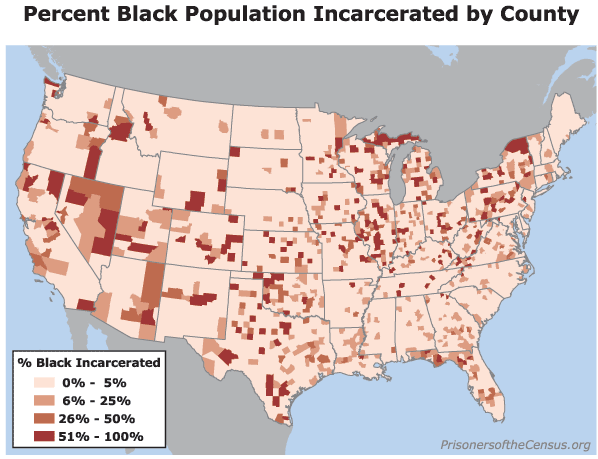
Figure 9. Many counties report that a large percentage of their Black population is incarcerated. From the Census data, it would appear that some of these counties have local policing and judicial systems with extreme racial biases. That may or may not be true, but what the data actually represents is a tendency on the part of state and federal authorities to construct prisons in counties that are not necessarily similar to the communities where most prisoners originate.
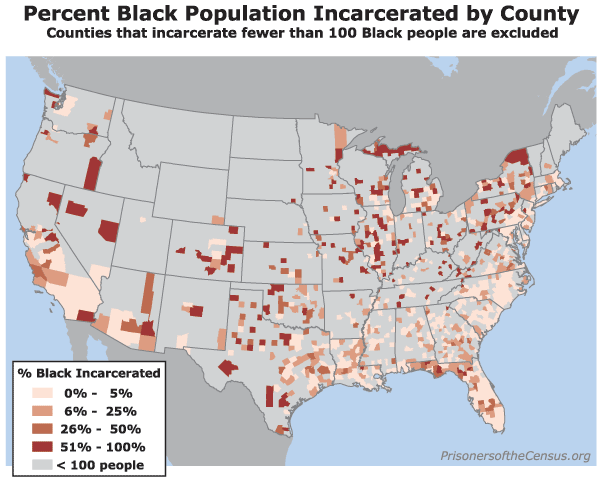
Figure 10. Because many counties are small, and because many counties share regional jails, counties with very small Black populations may appear to be significant incarcerators of Blacks when they are not. This map excludes from consideration counties that report less than 100 Black incarcerated residents in the Census. When these small counties are removed from the analysis, the number of statistical quirks caused by the Census Bureau's usual residence rule remains quite significant.
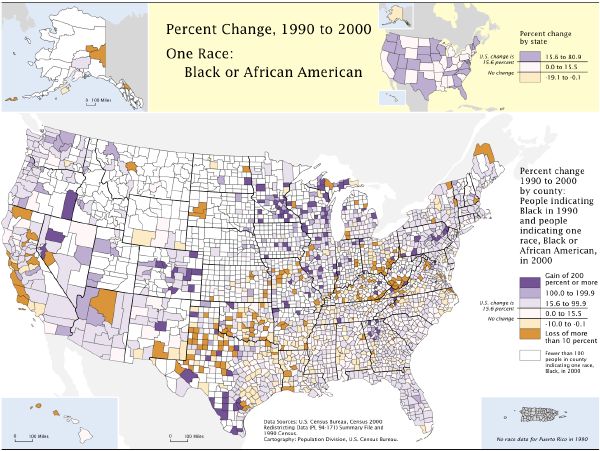
Figure 11. Many counties (in dark purple) report significant Black populations doubling in size from 1990 to 2000. In many of these cases, the cause is not willing Black migration, but the construction of new prisons. (Map source: U.S. Census Bureau, Mapping Census 2000: The Geography of U.S. Diversity.)
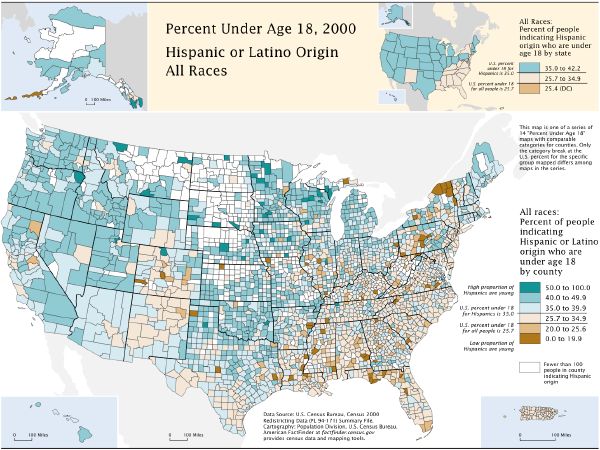
Figure 13. Many counties (in dark brown) report a significant Latino population, but report few Latinos under the age of 18. In most of these cases, this is not the result of people deciding not to have children, it's the result of the Census counting large Hispanic prison populations as residents of counties that otherwise do not have a significant Hispanic population. (Map source: U.S. Census Bureau, Mapping Census 2000: The Geography of U.S. Diversity.)
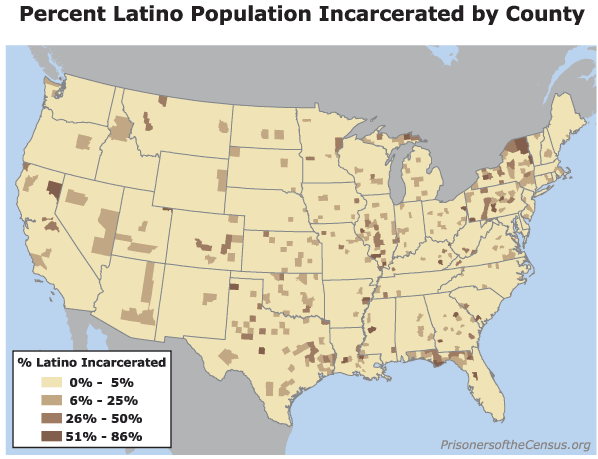
Figure 14. The Census reports that many counties have a large percentage of their Latino population incarcerated in correctional facilities.
Impact on gender statistics
Given that 92% of the people in prisons and jails are men, including these populations as local residents can create a large hidden shift in gender and marriage data used for planning social services and future growth.[11]
Nationally, there are 86 unmarried men for every 100 unmarried women in the United States.[12] The ratio will vary between neighborhoods, cities, regions and states from a variety of influences. Some are the reflection of women's greater longevity compared to men, different cultural ideas about marriage, and some are the result of social and economic demographics like the concentration of young people in particular areas. (See Figure 15.)
The disparity between states is somewhat small, ranging from Alabama and Rhode Island at 79 unmarried men to 100 unmarried women, to Alaska at 114 unmarried men per 100 unmarried women. (Alaska is a very small state that has many industries that rely on imported male workers. The next state is Nevada at 103 unmarried men per 100 unmarried women.)
Unlike the state to state disparity, the county disparity is huge, ranging from 53.8 to 362 unmarried men per 100 unmarried women. While relatively useful for some purposes on the state level, this data is more difficult to use on the county or town level because the Census includes "special populations" of prisoners and soldiers -- which tend to be male -- in with the local community rather than at their actual homes.
A report in Ohio's Fremont News Messenger is typical of the problems that this data can create and of the limited options researchers have to fix it. Analyzing the Census Bureau's Marital Status 2000 report, the News Messenger found that of the 5 Ohio counties identified by the Census as containing more unmarried men than unmarried women, all 5 of these counties contained large prisons.
The News Messenger article focused on the data less for its policy implications than as a human interest story about the best places to be single and dating. Yet the difficulties experienced by the News Messenger are illustrative. Reporter Greg White was able to manually correct for the prison-effect in rural prison counties by subtracting the prisoner population, but he could only guess the impact in urban communities where most prisoners originate:
Even if a county has a prison, that does not hinder dating prospects for most women [because the true number of men is unchanged by the presence of the prison], said Carol Getty, who teaches criminal justice at Park University in Parkville, Mo. The biggest problem comes in some urban neighborhoods where up to half of men in their late teens and 20s may be in prison.[13]
If the Census counted prisoners at their home addresses, the whole exercise of correcting the data for actual use would be moot, and the data would be more useful.
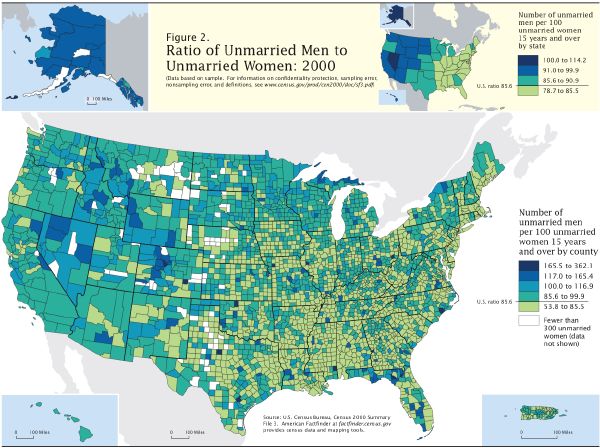
Figure 15. Many counties (in darkest blue) report having more than double the U.S. average ratio of unmarried men to unmarried women. In many of these counties, the origin of the disparity is the inclusion of large male prisons as a part of the county's statistics. (Map source: U.S. Census Bureau, Marital Status 2000.)
Impact on income statistics
The Census Bureau's enumeration of prisoners as residents of the prison towns complicates research and frustrates efforts at the state level to shift resources appropriately. Prisoners are included in per-capita income statistics. How large of an impact this has on the perception of the relative poverty of communities and on ensuing government policy has not yet been fully explored.
It would appear that urban areas that have a high incarceration rate would artificially have their per-capita income figures raised by not being able to count the prisoners as residents. Prison hosting areas would, by the per-capita income measure, look poorer as a result of the inclusion of the prisoners as local residents. This issue may be the most complicated for data users to correct, as it requires an understanding of how much income, if any, prisoners earn in a year.
Rural communities that host prisons are often quite impoverished in their own right. However, the authors are not aware of any study of rural economic development in which the researchers corrected for the impact of prisoners on per capita income before conducting their analysis.
For example, rural prison-hosting Cumberland County, New Jersey is an impoverished county on par with the urban counties that contain Newark and Trenton. Cumberland County ranks 3rd in New Jersey for counties with large portions of their households making under $10,000 a year. Cumberland County is the only New Jersey county where the median household income in 1999 was below $40,000, and it has the lowest per-capita income in the state at $17,376.[14] Prisoners and other group quarters populations are excluded from household income statistics, but are included in per-capita income. If we assumed that prisoners have no income and we deduct them from the calculations, the per-capita income for Cumberland County would rise a significant $897.
More research needs to be done as to the impact of prisoners on per-capita income. What do prisoners in various states report as their income? In states where Census forms are completed administratively, how is this data calculated? Our own informal research suggests that prison wages are inadequate for subsistence and that many prisoners rely on gifts from family members. Are these funds counted as income, and most importantly, should they be? And while these answers would allow a sophisticated data user to more accurately interpret Census income data in prison hosting communities, the urban policy analyst would still be unable to know where incarcerated people should have been counted and what their impact would be on income statistics in particular neighborhoods.
Conclusion
The statistical impact of counting incarcerated people as prison-town residents, rather than residents of their places of origin, is largest in prison hosting communities because the incarcerated population tends to be a large portion of the community. It is often possible for a knowledgeable researcher -- at great effort -- to adjust the data to remove the incarcerated population and make the data match the prison community's conception of itself.
Although the magnitude of the impact is smaller in the prisoner-exporting communities, Census data is of no assistance in restoring incarcerated people back to their census block of origin. Researchers and policymakers must instead rely on judicial or corrections data which rarely contain the same level of detail as official Census data. The result is that researchers often conclude -- like the Fremont News Messenger discovered -- that no matter how much they manipulate the data, they can't use Census data to give an accurate portrayal of urban high incarceration communities.
The good news is that Census Bureau policy on how to Count the population is not fixed in stone. Since the first census in 1790, the Census Bureau has continually updated its methodology. When evolving demographics and politics meant more college students studying far from home and more Americans living overseas, the Census policy changed in order to more accurately reflect how many Americans were living where. Today, the growth in the prisoner population requires the Census to update its methodology again.
Counting incarcerated people at the prisons and not at their homes might have made sense decades ago. But now, the problem it creates for users of Census data is simply too big to ignore.
Endnotes
[1] Public Law 94-171 (1975)
[2] Peter Wagner, Prior to 1990 Census, prisoners were not explicitly excluded from Census counts, PrisonersoftheCensus.org Fact of the Week for December 8, 2003.
[3] Peter Wagner, Diluting democracy: Census quirk fuels prison expansion, April 2004. Prison Policy Initiative.
[4] Peter Wagner, Census counts of prisoners shift population in California, PrisonersoftheCensus.org Fact of the Week for March 15, 2004.
[5] Peter Wagner and Rose Heyer, Pennsylvania State Summary, http://www.prisonersofthecensus.org/pennsylvania.html
[6] Peter Wagner, How Census Bureau counts prisoners undercounts Michigan's cities, PrisonersoftheCensus.org Fact of the Week for April 5, 2004.
[7] JoAnne Viviano, Valleys are still losing people, The Vindicator (Youngstown, Ohio) July 14, 2003 and Peter Wagner, Counting prisoners as prison-town residents leads to "misleading" conclusions about growth, PrisonersoftheCensus.org Fact of the Week for August 4, 2003.
[8] Jeff Hansen, Brent is booming, behind iron bars, Birmingham News, July 18, 2003 and Peter Wagner, Counting prisoners as prison-town residents leads to "misleading" conclusions about growth, PrisonersoftheCensus.org Fact of the Week for August 4, 2003.
[9] Erika Rosenberg, Upstate's outlook mostly murky, Democrat and Chronicle (Rochester, NY) August 24, 2004. and Rolf Pendall, Upstate New York's Population Plateau, The Brookings Institution. August 2003.
[10] Cynthia A. Brewer and Trudy A. Suchan, Mapping Census 2000: The Geography of U.S. Diversity, Census Bureau, p. 17.
[11] "Planning and implementing many government programs calls for accurate information on marital status, including the numbers of employed married women, elderly widows living alone, and single young people who may soon establish homes of their own. Data about marital status are used for budget and resource planning to identify the number of children needing special services, such as children in single-parent households. Local governments need data about marital status to assess the need for housing and services under Community Development Block Grant Evaluation. Other examples of statutory applications include the Public Health Service Act, Child Welfare Act, Adolescent Family Life Projects, and Low-Income Tax Credits." Census Bureau, Marital Status 2000, pp. 11-12.
[12] Census Bureau, Marital Status 2000, page 7.
[13] Greg Wright, Where the boys are -- behind bars, Fremont News Messenger (Ohio), October 22, 2003.
[14] Peter Wagner, Miscounting prisoners complicates Census portrait of New Jersey, PrisonersoftheCensus.org Fact of the Week for March 22, 2004.
About the authors
Rose Heyer is the GIS Analyst for the Prison Policy Initiative. She developed the Geographic Information System research strategy for the Prisoners of the Census project and consults with other organizations on the use of GIS for criminal justice reform advocacy.
Her most recent publication is, with Peter Wagner, Thirty-two years after Attica: Many more Blacks in prison but not as guards, the first analysis of the geographic origins in the racial disparity between prisoners and prison staff.
Peter Wagner is Assistant Director of the Prison Policy Initiative, an Open Society Institute Soros Justice Fellow, and a 2003 graduate of the Western New England College School of Law. Mr. Wagner is the author of "Importing Constituents: Prisoners and Political Clout in New York" (April, 2002), the first systematic state analysis of the impact of prisoner enumeration policies on legislative redistricting. He has spoken and testified at numerous national and state forums on this topic. Mr. Wagner edits PrisonersoftheCensus.org and writes a weekly fact column for the website about the varied impacts on society from miscounting prisoners.
His most recent publications are "The Prison Index: Taking the Pulse of the Crime Control Industry" (April 2004) and with Eric Lotke, "Prisoners of the Census: Electoral and Financial Consequences of Counting Prisoners Where They Go, Not Where They Come From" (forthcoming, Pace Law Review).
Acknowledgements
This research was supported by a grant from the Soros Justice Fellowship Program of the Open Society Institute.
About the Prison Policy Initiative
The Prison Policy Initiative (PPI) conducts research and advocacy on incarceration policy. Its work starts with the idea that the racial, gender and economic disparities between the prison population and the larger society represent the grounds for a democratic catastrophe. PPI's concept of prison reform is based not only in opposition to a rising rate of incarceration, but in the search for a lasting solution to pressing social problems superior to temporarily warehousing our citizens in prisons and jails.
The Prison Policy Initiative is based in Cincinnati, Ohio and Northampton, Massachusetts. For more information about PPI or prison policy in general, visit http://www.prisonpolicy.org.
Recommended Reading:
About the Prison Policy Initiative
Learn more about the organization behind the Prison Gerrymandering Project.

In prisons, Blacks and Latinos do the time while Whites get the jobs
We explore the racial disparity inside prisons.

McAlester, Okla. ends prison gerrymandering, Census Bureau can do better
McAlester, Okla., finally ended prison gerrymandering after a decade of trying. It's time for a national solution.

Prison-based gerrymandering's historical precedent
This is not the first time a policy barred people of color from the polls and transferred their political power to white voters.