by Peter Wagner,
April 26, 2004
Counting incarcerated people as if they were residents of the prison town leads to misleading portrayals of which counties are growing and which are declining. Declining populations in a county are often a sign of economic distress. Census 2000 reported that 78% of counties experienced population growth during the 1990s. Yet 56 of these counties can attribute their growth only to prison expansion and not to children being born or new residents choosing to move to the county. Said another way, for each 50 counties labeled by the Census as growing during the 1990s, one of those counties actually saw a decline in their actual free population. (See map and table.)
Continue reading →
by Peter Wagner,
April 22, 2004
Alan Elsner’s new book on the U.S. prison system, Gates of Injustice: The Crisis in America’s Prisons includes a call for reforming how the U.S. Census counts prisoners. Counting prisoners in the facility town and not at home is discussed in Chapter 10 about rural prisons and is included in Chapter 12’s list of “Some Modest Suggestions”:
“The way in which the Census Bureau counts inmates as citizens of the jurisdictions where they are jailed for purposes of drawing political boundaries or awarding federal grants seems like a clear case of inequity…. Fixing this would send a strong signal of the nation’s continued commitment to social justice.”
Source: Alan Elsner, Gates of Injustice: The Crisis in America’s Prisons, Prentice Hall, 2004, p. 221.
by Peter Wagner,
April 19, 2004
Counting large external populations of prisoners as local residents leads to misleading conclusions about the size and growth of communities. Many of the prison hosting counties have relatively small actual populations, but large prison populations. Twenty one counties in the United States have at least 21% of their population in prison. (See map and table.) In Crowley County, Colorado and West Feliciana Parish, Louisiana, one-third of the population consists of prisoners imported from somewhere else.
Continue reading →
by Peter Wagner,
April 12, 2004
Rose Heyer and I will release a new report tomorrow: Too big to ignore: How counting people in prisons distorted Census 2000. The report is the first national look at the impact of prisoner enumeration policies on the county population size, growth, race, ethnicity, gender and income. The Census counts prisoners as if they were residents not of their homes but of the prison town. The report concludes that due to modern uses of Census data and high incarceration rates, the impact is now too big to ignore. It’s time to update the Census Bureau’s method of counting the incarcerated and start counting prisoners at their home addresses.
Findings include:
- Twenty one counties in the United States have at least 21% of their population in correctional facilities.
- One out of every 50 counties reported as growing during the 1990s actual saw a decline in the actual population. New prison cells made these counties appear to be growing.
- Census data report rapidly growing Black populations in rural white counties. This population consists not of willing migrants but primarily of prisoners moved to the county for temporary incarceration.
- Many counties report concentrations of Latino adults without many children. These too are frequently the results of a prison in the community.
- Many of the counties where unmarried men outnumber unmarried women are counties with large male prisons. This ratio is useful for government planning, but due to the impact of prisons is difficult to use below the state level.
- Inclusion of prisoners in per-capita income figures complicates efforts to study and address rural and urban poverty.
by Peter Wagner,
April 5, 2004
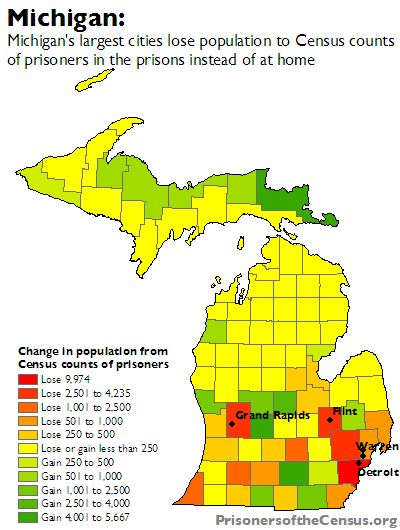
The way the Census Bureau counts state prisoners — not at home but as if they were residents of the prison town — reduces the population of Michigan’s largest cities and makes the prison hosting counties look larger than they really are. Census Bureau figures influence a county’s political clout because these numbers are used to draw legislative district boundaries and distribute some state and federal funds.
Although only 20% of the state’s population, Wayne County (which contains Detroit) is the home of origin for almost 30% of the state’s prisoners. There is a large state correctional facility in the county, but Wayne County had almost 14,000 residents in state prison during Census 2000. As a result, the Census Bureau counted 9,974 Wayne County residents as residents of other counties because they were incarcerated outside the county. Kent, Genesee, Oakland, Ingham and Berrien Counties all lose population to this counting method. (See first map at right.)
Continue reading →