Eric Cadora shows how incarceration is concentrated in particular Brooklyn neighborhoods
by Peter Wagner, January 24, 2005
The Importing Constituents: Prisoners and Political Clout in New York report was able to quantify the population loss to New York City from the Census Bureau practice of assigning prisoners residence to the prison location rather than their homes, and the report was able to determine how this benefits up-state prison districts. In 2000, New York City had 43,740 of its residents credited to the communities that contain prisons. As much as 7% of one upstate district’s population is prisoners. Counting prisoners as prison-town residents reduces the number of actual residents in these districts, enhancing the weight of a vote in those prison districts. By extension, this vote enhancement dilutes the votes of residents elsewhere in the state.
We know that compared to the state as a whole, New York City disproportionately sends people to prison, but what about specific neighborhoods in the city? The Importing Constituents report talks of the potential impact on the assumption that prisoners are evenly distributed in the city. Even with that assumption, there was a clear problem in need of a fix. But when the report was written, nobody knew exactly where in the city prisoners came from. The Census Bureau doesn’t collect this information, and the Department of Correctional Services does not publish this information in any more detail than the number of prisoners that come from New York City as a whole. As the Importing Constituents report said, prisoners are very likely concentrated in particular communities. This concentration would mean that specific districts suffer a measurable vote dilution beyond not receiving the same vote enhancement existing in the prison districts.
One recent analysis of prisoner origin in Brooklyn does suggest that prisoners are highly concentrated in origin. As part of a study looking to see where the state spends its criminal justice resources, Eric Cadora used judicial records to map the homes of prisoners from the Brooklyn borough sent to state prison in 2003. He found 35 blocks where more than $1million in state funds were spent to take people out of that community in 2003. Figure 1 is a map of Mr. Cadora’s research as published in the Village Voice. As Cadora used the figure of $30,000 per year to incarcerate someone, each of those 35 blocks would have at least 33 people sent to prison that year. The one “$5 million dollar block” would translate into 167 people that should have been credited by the legislature’s map makers to a single block in Brooklyn. (See Figure 1.) This map isn’t directly translatable to a redistricting analysis, but it does make the very strong case that prisoners are highly concentrated in origin. The clear message is that some communities in Brooklyn lose far more population to prison — and the Census counts of prisoners — than others.
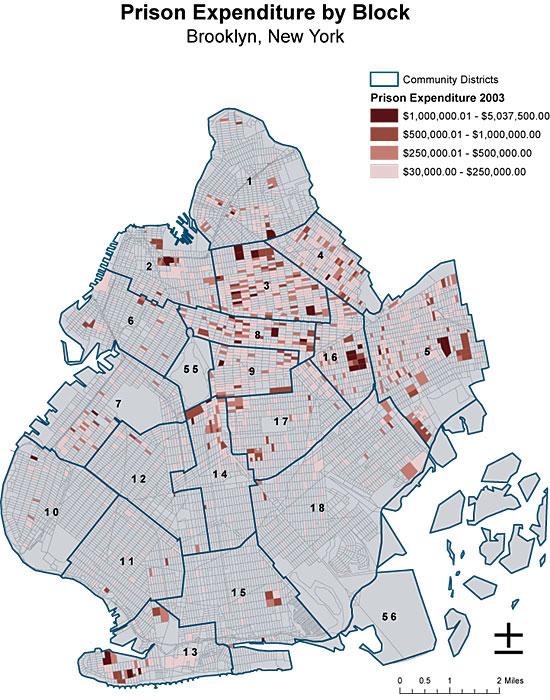
Figure 1. Eric Cadora’s map of high incarceration communities in Brooklyn, New York and expressed in terms of the cost to incarcerate residents of each block. The map was published in the Village Voice on November 16, 2004.
Eric Cadora’s research and map also allows some additional analysis to be made of the communities that see large numbers of people go to prison. Figure 2 is a map of the Black population in Brooklyn. Comparing the two maps, we see that what Eric Cadora identified as the blocks that send large numbers of people to prison are also the same blocks with large Black populations.
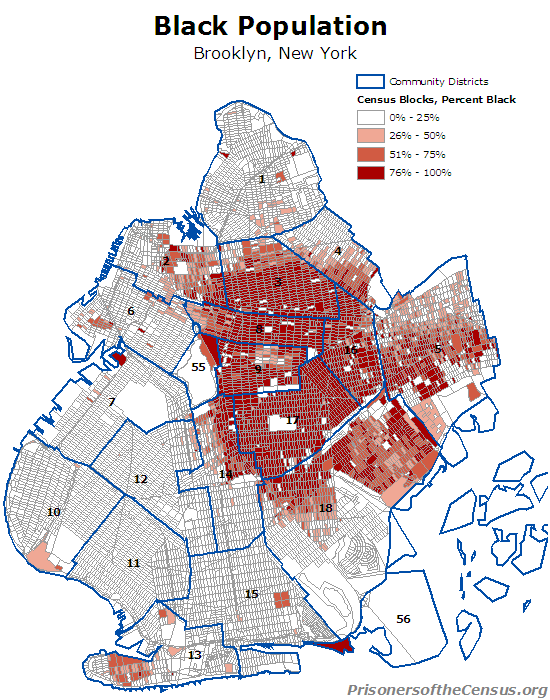
Figure 2. Black populations in Brooklyn. Eric Cadora’s million dollar blocks are largely blocks with large Black populations.
The Importing Constituents report showed that the Census Bureau’s method of counting prisoners disadvantages the city of New York to the benefit of predominantly white rural areas. Eric Cadora’s research provides more evidence for what many have long suspected — that incarceration impacts certain disadvantaged communities much more severely than other communities. If we want to accurately count these communities and give them their fair share of political power in the legislatures, then the population of these communities needs to be counted in those communities.
Note: See also Eric Cadora’s earlier analysis Criminal Justice and Health and Human Services: An Exploration of Overlapping Needs, Resources, and Interests in Brooklyn Neighborhoods, [PDF] Urban Institute. January, 2002. That report only goes down to the tract level and includes jail populations as well, but it also creates extremely useful comparison maps of singe parent households, youth concentrations, and people on various public assistance programs. These are largely all co-incident populations.


