Miscounting prisoners complicates Census portrait of New Jersey
by Peter Wagner, March 22, 2004
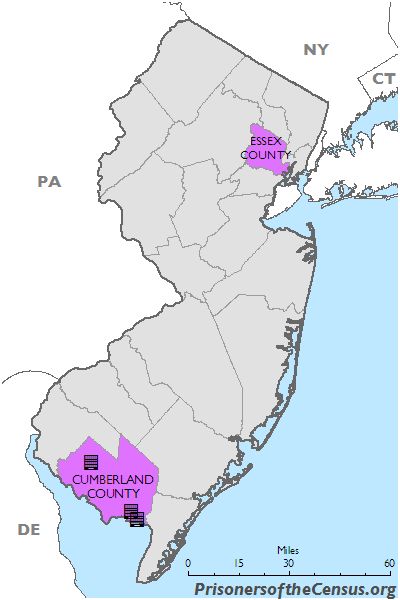
Eighteen percent of New Jersey’s prisoners are from Essex County which includes Newark. Thirty percent of the state’s prisoners are incarcerated in Cumberland County far to the south.
Essex County (which includes the city of Newark) sends more residents to prison than any other county in New Jersey. Essex County is home for 18% of New Jersey’s prisoners, but only 9.4% of the state’s population. With only 11% of the state’s prison cells located in Essex County, many prisoners are incarcerated outside the county.
The U.S. Census counts prisoners not at their homes but as if the prisoners were residents of the prison town. This changes county populations and skews their demographics.
[The situation in Camden County is similar. Camden County has 6% of the New Jersey’s population but supplies 14% of the state’s prisoners. Only 5% of the state’s prisoners are are incarcerated in Camden County.]
Rural Cumberland County is 120 miles to the south of Newark on Delaware Bay. Only 2% of New Jersey’s prisoners call Cumberland County home, but almost 30% of the state’s prisoners are incarcerated in three large prisons in the county. This shift in the population affects how much representation each of these counties receives in the legislature. But attempts by policy makers to examine the needs of these counties is complicated by the impact of prisoners on other statistics.
Essex County is troubled by more than its high incarceration rate. Of all the counties in the state, it has the highest portion of its households making less than $10,000 a year (13%) and the highest portion of its households receiving public assistance (6.5%).
Rural prison-hosting Cumberland County is also an impoverished county. Cumberland County ranks 3rd in counties with large portions of their households making under $10,000 a year. It is the only county in New Jersey where the median household income in 1999 was below $40,000.
Unfortunately, the Census Bureau’s enumeration of prisoners as residents of the prison towns complicates research and frustrates efforts at the state level to shift resources appropriately. Prisoners are excluded from the household income figures cited above, but the Census includes prisoners in per capita income calculations. Cumberland County has the lowest per capita income in New Jersey, at $17,376. If we assumed that prisoners have no income and we deduct them from the calculations, the per capita income for Cumberland County would rise a significant $897.
More research needs to be done as to the impact of prisoners on per capita income. What do prisoners in various states report as their income? In states where Census forms are completed administratively, how is this data calculated? My own informal research suggests that prison wages are inadequate for subsistence and that many prisoners rely on gifts from family members. Are these funds counted as income, and should they be? And of course, should every user of Census county income data be required to first receive a degree in prison studies?
Prison Admissions per 1,000 Residents by Block-Group, Essex County, New Jersey, 2001.
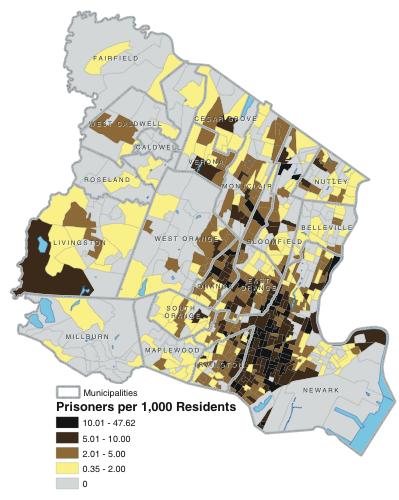
The majority of Essex County’s prisoners come from a small number of communities within the county.
Source: A Portrait of Prisoner Reentry in New Jersey, by Jeremy Travis, Sinead Keegan, Eric Cadora, et. al. November 2003, page 52.
Most critically, we need more accurate information about where prisoners come from. New Jersey is one of a number of states that publishes county of commitment information. This data provides the shocking data that Essex County has the highest incarceration rate in the state, but it does not tell us whether the prisoners are spread out throughout Essex County or concentrated in Newark. For proper planning, accurate statistics are essential.
A recent Urban Institute study of prison admissions data shows that prisoners sent to prison from Essex County overwhelming originate in Newark and its neighboring communities. (See map at right.) In a number of parts of Newark, as many as 1% to 5% of the population was sent to prison during 2001. The cities of Newark, Orange and East Orange each lost about 5 residents to prison for each 1,000 people in the community. Seven municipalities in the western portion of the county incarcerated their residents at a rate one-tenth of that.
While single year admissions data can’t be used to recalculate the Census, it does show that that incarceration has radically different effects on different communities within a county. Knowing precisely how many prisoners incarcerated during the Census come from each of the communities in a state would give us an accurate portrayal of our communities and help policymakers make informed decisions. Where are all of New Jersey’s prisoners from? That is a question that the Census Bureau should answer for us in 2010.


