Importing Constituents: Prisoners and Political Clout in Pennsylvania
by Peter Wagner and Elena Lavarreda
June 26, 2009
- Sections
- I. Introduction
- II. Counting incarcerated people as residents of prison towns skews demographic data
- III. Redistricting and “One Person, One Vote”
- IV. Recommendations
- V. Methodology
- Acknowledgements
- About the authors
- Endnotes
I. Introduction
The Census Bureau counts Pennsylvania prisoners as if they were residents of the communities where they are incarcerated, even though they can’t vote and remain legal residents of the places they lived before they were incarcerated.
Crediting thousands of mostly urban and minority men to other communities has staggering implications for modern American democracy, which uses the Census to apportion political power on the basis of equally-sized legislative districts.
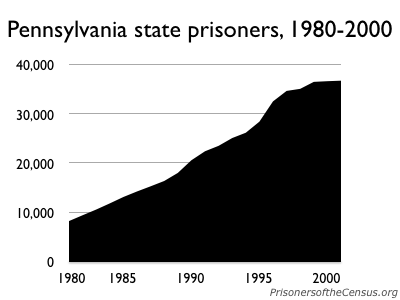
Figure 1. The number of state prisoners in Pennsylvania grew from 8,112 in 1980 to 36,614 in 2000.
The Census Bureau has always counted prisoners as residents of the prison location, but it is only recently that the population in prison is large enough to effect legislative districting. As recently as 1980, the Pennsylvania prison system had just over 8,000 prisoners, compared to 4.5 times as many in 2000.[1] Moreover, using population as the sole measure of political apportionment in state and local government is also quite new. Counting prisoners as residents of the facility might have made sense in the country’s first century, when the mandate of the Census was limited to determining the relative populations of states. But today, state legislatures use the Census to apportion political power within each state.
However, the Census Bureau's prison count violates the law of Pennsylvania and that of most states, which says that prison is not a residence. A legal residence is the place that people choose to be and do not intend to leave.[2] The statutes are explicit:
[N]o individual who is confined in a penal institution shall be deemed a resident of the election district where the institution is located. The individual shall be deemed to reside where the individual was last registered before being confined in the penal institution, or if there was no registration prior to confinement, the individual shall be deemed to reside at the last known address before confinement.[3]
Today, our conception of democracy requires far more detailed and accurate data to reflect where the population — including people in prison — actually lives. In almost every respect, except for how it counts people in prison, the Census Bureau’s methodology has evolved to keep pace with the changing needs for its data. But now that such a large percentage of the population is incarcerated, where the Census Bureau counts people in prison is a question of critical importance.
II. Counting incarcerated people as residents of prison towns skews demographic data
Counting incarcerated people as if they were residents of prison towns leads to misleading portrayals of such communities. Blacks are 9.2 times as likely to be in prison as White people,[4] but the state and federal prison cells are located in disproportionately White counties. Ninety-three percent of prisoners in Pennsylvania are incarcerated in counties that have a larger proportion of White people than the state has as a whole. In Somerset County, 91% of the Black population reported in the Census are not residents, but prisoners incarcerated at the Somerset and Laurel Highlands prisons in the county. (See Appendix C, County Demographics.)
The prison communities also tend to be small enough that incarcerated populations are a significant portion of the total “residents” counted by the Census. One out of every 8 people reported by the Census in Union County is incarcerated at the federal Allenwood and Lewisburg prisons.
There is also a geographic disparity in who goes to prison in Pennsylvania. The residents of the Philadelphia County and Dauphin County (Harrisburg), are much more likely to be incarcerated than the residents of other counties. The residents of Philadelphia County are more than 3 times as likely to be in prison than the average resident of the state, and more than 7 times as likely as the residents of prison-hosting Somerset and Huntingdon Counties. Twelve percent of the state’s population is in Philadelphia, but 40% of the state’s prisoners are from that city.[5] 99% of the state’s prison cells are located outside of Philadelphia.
While the Census Bureau’s practice of counting prisoners as residents of the prison location complicates using the Census for demographic analysis of rural communities, the miscount creates even more damage to state democracy.
III. Redistricting and “One Person, One Vote”
Eight of Pennsylvania’s House districts meet federal minimal population requirements only because the state treats prisoners as residents of the district with the prison. To ensure that each resident has equal access to government, regardless of where she or he lives, federal law requires legislative districts each contain the same population. When districts are of substantially different sizes, the weight of each vote starts to differ: in underpopulated districts, each vote is worth more, and in overpopulated districts, a vote is worth less.
By Pennsylvania law, prisoners can’t vote and are considered legal residents of their pre-incarceration addresses. But by using Census Bureau counts of prison populations to pad out rural legislative districts, Pennsylvania is inflating the votes of residents who live near prisons.
The U.S. Supreme Court first declared that the “One Person, One Vote” principle applied to state legislative redistricting in the 1963 landmark case Reynolds v. Sims.[6] The Court struck down an apportionment scheme for the Alabama state legislature that was based on counties and not population. Under Alabama’s apportionment plan, sparsely populated Lowndes County had the same number of state senators as densely populated Jefferson County. This gave the residents of Lowndes County 41 times as much political power as the residents of Jefferson County. Reynolds v. Sims barred this practice and put it plainly: “The weight of a citizen’s vote cannot be made to depend on where he lives.” The Supreme Court ruled that the 14th Amendment’s equal protection clause required that districts be drawn to be substantially equal in population.
Subsequent U.S. Supreme Court cases defined the limits of “substantially equal.” In White v. Regester,[7] the Court ruled that the state of Texas was not required to justify how it drew lines resulting in an average district deviation of less than 2% and a maximum deviation of 9.9%. Allowing these small differences in district population sizes helps to protect other legitimate state interests, such as keeping communities of interest in the same legislative district. Today, most states draw their districts so that the smallest district is no more than 5% smaller, and the largest no more than 5% larger, than the average district. This keeps the difference between the largest and smallest district within 10%.
In Pennsylvania, a State House of Representatives district is supposed to contain 60,498 people, plus or minus 3,025 people. The legislative commission that drew Pennsylvania’s districts in 2001 met the federal standard of population equality, but only because prisoners were counted in the wrong place.
For example, District 147 in northern Montgomery County, represented by Bob Mensch (R), is a little short of it’s required Census population with 59,618 people, but 3,404 of that population is actually incarcerated at SCI-Graterford[16]. Without using the prison population as padding, the actual population of the district is 56,214, smaller than that allowed by federal law.
The effect is even larger in District 85 in Union and Snyder counties, represented by Russell H. Fairchild (R). That district reports a Census population that is slightly larger than it should be, but without the 5,290 people incarcerated at the Allenwood and Lewisburg federal prisons, the district actually only contains 55,968 people. The actual population of the district is 7.5% smaller than the average district and must therefore be redrawn. Almost 8% of District 85’s required population does not exist, giving every group of 92 residents in District 85 the same voting power as 100 people elsewhere in state.
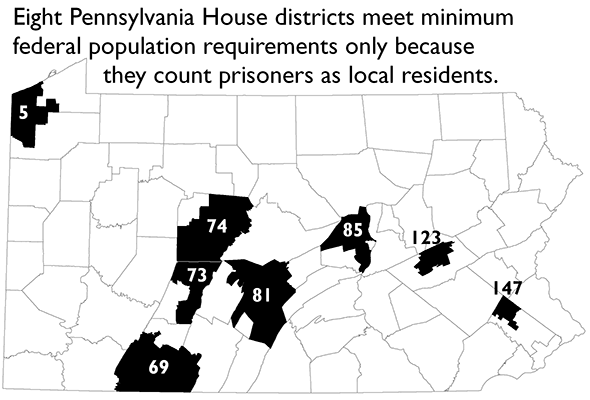
Eight Pennsylvania House districts meet federal minimum population requirements only because the state treats prisoners as residents of the district with the prison. See figure 2.
| District | Rep | Prisoners (state and federal) | Percent deviation from required population | Home County | Name of prisons |
|---|---|---|---|---|---|
| 85 | Fairchild, Russell H. | 5,290 | -7.50% | Union | FCI Lewisburg & FCI Allenwood |
| 147 | Mensch, Bob | 3,404 | -7.10% | Montgomery | SCI Graterford |
| 123 | Goodman, Neal P | 4,390 | -6.60% | Schuylkill | FCI Schuykill, SCI Frackville & SCI Mahoney |
| 81 | Fleck, Mike | 3,140 | -6.00% | Huntingdon | SCI Huntingdon & SCI Smithfield |
| 74 | George, Camille Bud | 2,034 | -5.80% | Clearfield | SCI Houtzdale & Quehanna Boot Camp |
| 73 | Haluska, Gary | 2,108 | -5.80% | Cambria | SCI Cresson & FCI Loretto |
| 69 | Metzgar, Carl Walker | 2,142 | -5.60% | Somerset | SCI Laurel Highlands & SCI Somersert |
| 5 | Evans, John R. | 1,880 | -5.50% | Erie | SCI Albion |
Figure 2. Eight House districts meet federal minimum population only because they include incarcerated people as local residents. See Appendix A for the details on all House districts.
Further, crediting large urban non-voting populations to remote prison districts has a focused and negative impact on the political strength of Black residents. Fifty-five percent of the state’s prisoners are Black[8], but 93% of the state’s prison cells are located in House districts that are disproportionately White.
As Appendix D (Incarceration Rates by County) illustrates, Pennsylvania’s prison population is disproportionately urban in origin. For example, only 12% of Pennsylvania lives in Philadelphia, but the city is home to 40% of the state’s prison population.[9] Available Department of Corrections data does not allow us to determine exactly which legislative districts people in prison come from, but is clear that much of the prison population should have been credited to disproportionately urban and Black communities within Pennsylvania’s cities.
Instead, this population was credited to districts like southwestern Pennsylvania’s House District 69, where 92% of the Black population is powerless to vote for or against the representative because they are incarcerated and barred from the polls. Without the 1,164 Black prisoners as population, the district has the second smallest Black population in the state.
Pennsylvania’s decision to rely on flawed Census counts of the prison population artificially enhances the representation afforded to predominantly white districts with prisons and waters down the voting power of everyone else. Eight legislative districts lack sufficient population to meet accepted one-person, one-vote standards without counting disenfranchised prisoners as part of their population base. At the same time, heavily minority urban districts would in all likelihood be entitled to additional representation if prisoners were counted as residents of their home communities for purposes of redistricting.
IV. Recommendations
The Census Bureau’s decision to credit thousands of disenfranchised non-residents to the Census blocks with prisons creates serious problems for Pennsylvania. This problem need not exist in the future, as the state can fix the actual data or lobby the Census Bureau for change.
IV. A. Pennsylvania should adjust the U.S. Census’ count of prisoners prior to redistricting
While states must redistrict on the basis of actual population, the U.S. Constitution does not require states to use the federal census for its own redistricting. In 1971, the City of Philadelphia and Pittsburgh Congressman James G. Fulton, fearing a loss of representation, sued the Census Bureau for counting military personnel, students and prisoners at their temporary addresses instead of their home addresses.
The U.S. Court of Appeals for the Third Circuit refused to invalidate the just-completed Census, and instead directed the plaintiffs to seek relief from the state legislature:
Although a state is entitled to the number of representatives in the House of Representatives as determined by the federal census, it is not required to use these census figures as a basis for apportioning its own legislature. Therefore, appellants’ contention that they will suffer injury because of Pennsylvania’s reliance on the federal census for the apportionment of its legislative bodies is properly directed at the appropriate state law.…[10]
Pennsylvania can fix the Census data by collecting the home addresses of people in prison and then adjusting the U.S. Census counts prior to redistricting. Legislation with these goals has been introduced in New York[11] and Michigan,[12] and is patterned on how Kansas adjusts the federal census counts of military personnel and students. [13]
IV. B. The Census Bureau should change how it counts people in prison
The U.S. Supreme Court requires states to draw new districts each decade on the basis of population, but states are not required to use the U.S. Census. The Census Bureau, which collects its data at great cost, wants states to use its data and has historically been responsive to the needs of its data users when deciding how to count the population.
The ideal place to fix the prisoner miscount is at the U.S. Census Bureau. The method of counting other special populations has changed numerous times, in each case responding to changing demographics and needs. For example, when more college students began studying far from home, the Census policy changed in order to more accurately reflect American living situations.
IV. C. Pennsylvania and its individual leaders should ask the Census Bureau to change how it counts people in prison.
The Census Bureau considers redistricting to be the second most important use of its data and should therefore be responsive to requests for a new way of counting prisoners.
The state and individual state and local officials should lobby the Census Bureau, urging it to change its policy and count people in prison as residents of their last known address. Officials should consider endorsing the recent letter sent by New York State Senator Eric Schneiderman and St. Lawrence County Legislator Tedra Cobb.[15] The letter asks the Census Bureau to count prisoners as residents of addresses outside correctional facilities, and, if insufficient time remains before the 2010 Census to implement that change, that the Bureau publish a special version of the PL94-171 redistricting data file for the prison population. Such detailed, block-level counts of prison populations would assist Pennsylvania in identifying and removing the prison populations prior to redistricting.
V. Methodology
This report uses the correctional facility populations as counted by the Census Bureau and published in Summary File 1, Table P37. Our analysis is based on a subset of these data, filtered to include only state or federal prisoners and not people in jail, halfway house residents, etc. Our filtering methodology is documented in Section 2 of The Democracy Toolkit (2007). The Census does not publish race and ethnicity data for the group quarters population at the block level, so we exported our data to the mapping analysis software Arcview 9.2, through which we manually deduced the race and ethnicity of each facility’s population from tract-level data made available in tables PCT17B and PCT17H. In the few cases in which this was insufficient, we accessed race and ethnicity data for the individual blocks from Tables P7 and P11, which were then attributed to the correctional facility.
The 2000 Census placed SCI-Graterford at the wrong location, in Collegeville (Block 2000, Tract 206300) rather than at its correct location 5 miles away in Graterford (Block 9000, Tract 206702). The Census Bureau acknowledged the error during its Count Question Resolution Program, but this was too late for change any of the official data products from the Census Bureau. The Census Bureau made a number of similar errors in Pennsylvania, but this was the only one large enough to place a prison in a different district. Collegeville is in District 150, but the prison is actually in District 147. However, an examination of the population reported in the legislation authorizing the new districts and the census population contained within those districts shows that the legislature corrected the Census Bureau’s mistake. To ensure that our data matched that of the legislature, we therefore transferred the correctional population including its race and ethnicity counts in District 150 to District 147. The Census Bureau reported 101 prisoners at the correct location in Block 9000, but we did not include these in our analysis because the existing SCI-Graterford population was fully accounted for. If these 101 prisoners were included in the analysis, the vote dilution reported here would be even higher.
During this process we discovered that the legislature made a number of other small adjustments to the Census data or split Census Blocks between individual districts. Other than the prison correction discussed above, these are all relatively small, but they will result in small differences between the total populations reported by the legislature and that reported by the Census Bureau’s retabulation of the population within each legislative district in the Census 2000 State Legislative District Summary File (100-Percent) released as part of the 2010 Census Redistricting Data Program.
Because the raw data used by the legislature was unavailable, we used -- except for the Graterford correction discussed above -- the Census Bureau’s retabulation of district demographics for total population, race and ethnicity, so as to most closely match the actual data used by the legislature.
Acknowledgments
This research was supported by a grant from The After Prison Initiative of the Open Society Institute. This report benefited from the research assistance of law clerks Brett Blank, John Hejduk, and Aleks Kajstura and from Bill Cooper’s invaluable guidance parsing the technical documentation for the Census Bureau’s State Legislative Summary Files. We also thank Chris Sturr for his assistance improving the text of the report and Marie Gottschalk, Angus Love and Jon Yount for their feedback on earlier drafts of this report.
About the authors
Peter Wagner is an attorney and Executive Director of the Prison Policy Initiative. In 2002, he authored the first district-by-district analysis of the impact of Census counts of prisoners on state legislative redistricting, Importing Constituents: Prisoners and Political Clout in New York (2002). He has presented his research at national and international conferences and meetings, including a Census Bureau Symposium, a meeting of the National Academies, and keynote addresses at Harvard and Brown Universities. His publications include, with Rose Heyer, Too Big to Ignore: How Counting People in Prisons Distorted Census 2000 (2004) and, with Eric Lotke, Prisoners of the Census: Electoral and Financial Consequences of Counting Prisoners Where They Go, Not Where They Come From [PDF] (2005).
Elena Lavarreda is a 2008 graduate of Smith College and a policy associate at the Prison Policy Initiative.
About the Prison Policy Initiative
The Massachusetts-based non-profit, non-partisan Prison Policy Initiative documents the impact of mass incarceration on the larger society. Focusing on a once-obscure Census Bureau glitch that counts people in prison where they are temporarily held instead of the communities they come from; the Prison Policy Initiative demonstrates how the prison system reaches beyond prisons to punish people and communities not under criminal justice system control. The organization’s work to change how people in prison are counted has won the support of the New York Times editorial board and the Census Bureau’s own advisors at the National Research Council.
Endnotes
[1] Mother Jones Magazine, July 2001, Debt to Society: Pennsylvania, Increasing imprisonment.
[2] 25 Pa.C.S. §1302
[3] 25 Pa.C.S. §1302(3). A voting rights pamphlet [http://www.dos.state.pa.us/dos/lib/dos/20/convicted_felon_brochure_website.pdf] issued by the Pennsylvania Secretary of State and distributed to incarcerated people shows how the state interprets its own residence rules for incarcerated people.
[4] Mark Mauer and Ryan S. King, Uneven Justice: State Rates of Incarceration By Race and Ethnicity Table 6, 11 (July 2007).
[5] The relative population of Philadelphia is from U.S. Census 2000, and the origin of prisoners from Pennsylvania Department of Corrections Annual Statistical Report, 2000 [PDF] in Table 13 on page 26.
[6] Reynolds v. Sims, 377 US 533 (1964).
[7] White v. Regester, 412 US 755 (1973).
[8] Pennsylvania Department of Corrections Annual Statistical Report, 2000 [PDF], Highlights page (before page 25).
[9] U.S. Census 2000 and Pennsylvania Department of Corrections Annual Statistical Report, 2000 [PDF] in Table 13 on page 26.
[10] Borough of Bethel Park v. Stans, 449 F. 2d 575, 583 (C.A. 3, 1971). Two years later, when faced with a similar issue, the Supreme Court rejected Virginia’s argument that it was compelled to use the Census Bureau’s assignment of residences to military personnel when drawing state legislative districts. Mahan v. Howell, 410 U.S. 315, 331 (1973).
[11] New York Senate Bill 1934 was introduced by Senator Schneiderman on January 29, 2007.
[12] Michigan House Bill 4395 was introduced by Reps. Lemmons, Young and Gonzales on June 19th, 2007.
[13] In Kansas, “[s]enatorial and representative districts shall be reapportioned upon the basis of the population of the state adjusted: (1) To exclude nonresident military personnel stationed within the state and nonresident students attending colleges and universities within the state; and (2) to include military personnel stationed within the state who are residents of the state and students attending colleges and universities within the state who are residents of the state in the district of their permanent residence.” KS CONST. art. 10 § 1.
[14] A Resolution urging the United States Census Bureau to change its policy of recording the residence of incarcerated persons from the location of the correctional facilities to the last known home address of such persons, introduced by Reps. Cruz, Youngblood, Myers, Wheatley, Caltagirone, Parker, Josephs, Swanger and James on December 6, 2007.
[15] Letter from State Senator Schneiderman and County Legislator Tedra Cobb to Charles Louis Kincannon, Director of the Census Bureau, October 17, 2007. The letter is available at http://www.prisonersofthecensus.org/letter/ and the process of joining the letter is described at http://www.prisonersofthecensus.org/campaign/.
[16] The Pennsylvania legislature consciously credited SCI-Graterford to District 147 because they corrected a Census Bureau mistake that accidentally placed the facility in Collegeville, 16 miles away.
Recommended Reading:
About the Prison Policy Initiative
Learn more about the organization behind the Prison Gerrymandering Project.

The Racial Geography of Mass Incarceration
The transfer of Black and Latino incarcerated people to communities very different than their own is a nationwide problem.

How to get elected without being a candidate first.
Iowa Public Radio explores how Anamosa Iowa ended prison gerrymandering.
