Importing Constituents: Prisoners and Political Clout in Ohio
Census Bureau policy costs Ohio’s cities population
By Peter Wagner and Rose Heyer
July 6, 2004
The Census Bureau counts prisoners not at their homes but as if they were residents of the town that contained the prison. This administrative quirk reduces the population of the urban communities where most prisoners originate and swells the population of the rural communities that house prisons. Ohio now incarcerates more than 3 times as many people as it did as recently as 1980, making what would once be a trivial issue into a critical one.[1]
When the Census began in 1790, demographics-based planning and redistricting did not yet exist. The Census’ sole constitutional mandate was and is to count the number of people in each state to determine their relative populations for purposes of Congressional reapportionment. It didn’t matter — for purposes of comparing Ohio’s population to Pennsylvania — whether an incarcerated person was counted at home in Cleveland or in prison in Lucasville, as long as they were counted in Ohio. Times have changed but Census methodology has not.
Counting incarcerated people as if they were residents of the prison town leads to misleading portrayals of which counties are growing and which are declining. Declining populations are often a sign of economic distress. While most counties in the country grew during the previous decade, Marion County’s growth of 1,943 people is attributable only to prison expansion and not to children being born or new residents choosing to move to the county. Its actual population declined by 144 people.[2]
How the incarcerated are counted in Ohio is of critical importance to an accurate count of Black communities. While Blacks are 11.5% of the Ohio population, more than half of the incarcerated people in the state are Black. (See Figure 1.) Blacks in Ohio are incarcerated at a rate 7 times higher than White residents of the state.[3]
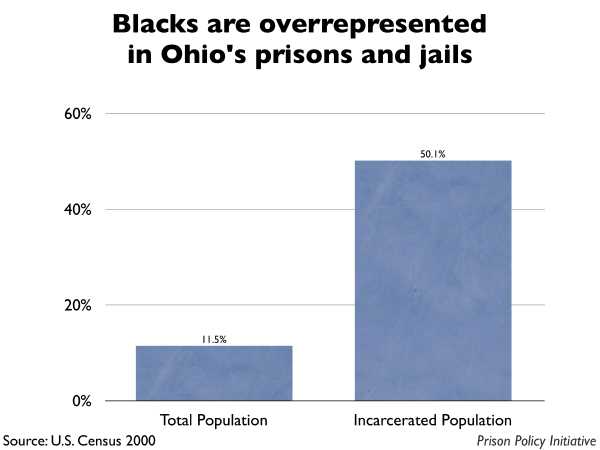
Figure 1. Incarceration in Ohio disproportionately affects Blacks. Source: U.S. Census 2000
Urban areas suffer, prison counties gain
All of Ohio’s major cities see a reduction in their Census population from how prisoners are counted. Although there are small state prison facilities in Cuyahoga County (Cleveland) Montgomery County (Dayton) and Franklin County (Columbus) the small gain is overshadowed by the loss. Cuyahoga County has 11,167 residents in prison with 10,441 incarcerated in other counties. The Census shows Hamilton County with 5,235 fewer people. This population is instead credited to the counties that contain the prisons. Pickaway County has a Census population of 53,437, but 5,583 of those people are actually prisoners from other parts of the state. (See Figure 2 below and Table 1 at bottom.)
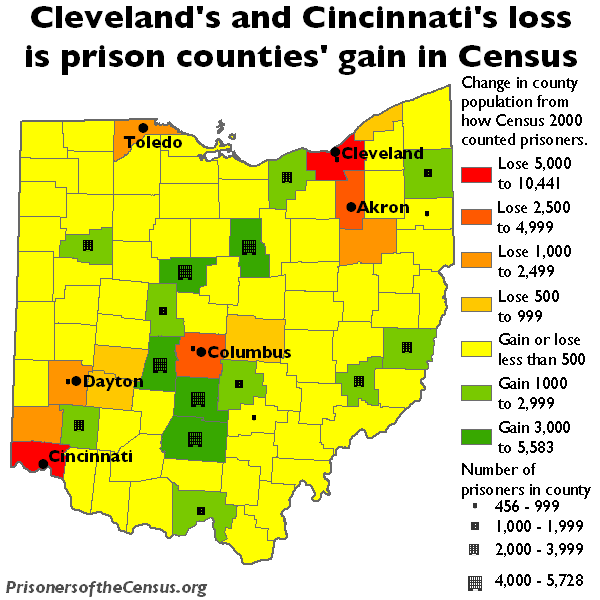
Figure 2. Ohio’s largest cities lose sizable population to a Census Bureau quirk that counts the incarcerated as if they lived in their remote prison cells.
Redistricting and One Person One Vote
Ohio relies on Census Bureau data to redraw its state legislative boundaries so that each will contain the same number of people as required by the 14th Amendment’s One Person One Vote principle. Equally sized districts ensure that each resident has an equal access to government regardless of where she or he lives. The Census counts everyone including people who can’t vote such as prisoners and children. But children are at least a part of the surrounding community and share some common interests with it. Children can with some confidence rely on their neighboring adults to represent their interests. But prison communities are often very closely aligned with the prison industry and are likely to be quite dissimilar to the communities that the prisoners came from.
So while prisoners are barred from voting for or against the legislator that “represents” them while they are incarcerated, Ohio restores a prisoner’s right to vote on the day that he or she is released. But that is also the same day that the former prisoner will be getting on a bus to leave the prison district and return back home.
Including disenfranchised non-resident prisoners as population for purposes of redistricting creates prison districts with substantially fewer constituents than elsewhere. The real residents of the prison district have more access to their legislator than other state residents.
In Ohio, a House district is supposed to contain 114,678 people. But because of how the Census Bureau counts the incarcerated population, the drafters of legislative districts should not assume that everyone is a resident of the place where they are counted. District 85 (in Ross, Pickaway and Fayette counties), currently represented by John Schlichter, is 8.92% prisoners. These disenfranchised prisoners are overwhelmingly from homes outside the district, meaning that the actual population of the district is very small. Every group of 91 residents in District 85 gets as much of a say over state affairs as 100 people in Columbus or Cleveland.
This is precisely the situation the One Person One Vote rule was designed to correct.
Recommendations:
Census Bureau policy on how to count the population is not fixed, instead it responds to changing needs. When evolving demographics meant more college students studying far from home and more Americans living overseas, the Census policy changed in order to more accurately reflect how many Americans were living where. Today, the growth in the prisoner population requires the Census to update its methodology once again.
The Census Bureau should update its methodology and count the incarcerated at their homes and not in remote prison cells. Until that time, states should follow the lead of Kansas which conducts a special Census to fix how college students and the military are counted for purposes of state redistricting, and conduct a special census to correct how prisoners are counted.[4]
Endnotes:
[1] Mother Jones Magazine, July 2001, Debt to Society: Ohio, Increasing imprisonment.
[2] Rose Heyer and Peter Wagner, Too big to ignore: How counting people in prisons distorted Census 2000, April 2004.
[3] Peter Wagner, State Incarceration rates by race, 2001 Prison Policy Initiative, April 2004
[4] Peter Wagner, Kansas proves adjusting Census is possible Prisoners of the Census Fact of the Week for November 17, 2003.
Tables
| County | Census 2000 population | Number of state prisoners from county | Number of state prisoners in county | Net change in population from Census counting method |
|---|---|---|---|---|
| Adams | 27,330 | 47 | 0 | -47 |
| Allen | 108,473 | 407 | 3,024 | 2,617 |
| Ashland | 52,523 | 126 | 0 | -126 |
| Ashtabula | 102,728 | 159 | 0 | -159 |
| Athens | 62,223 | 126 | 0 | -126 |
| Auglaize | 46,611 | 150 | 0 | -150 |
| Belmont | 70,226 | 136 | 2,156 | 2,020 |
| Brown | 42,285 | 56 | 0 | -56 |
| Butler | 332,807 | 1,123 | 0 | -1,123 |
| Carroll | 28,836 | 65 | 0 | -65 |
| Champaign | 38,890 | 159 | 0 | -159 |
| Clark | 144,742 | 571 | 0 | -571 |
| Clermont | 177,977 | 468 | 0 | -468 |
| Clinton | 40,543 | 145 | 0 | -145 |
| Columbiana | 112,075 | 225 | 0 | -225 |
| Coshocton | 36,655 | 75 | 0 | -75 |
| Crawford | 46,966 | 112 | 0 | -112 |
| Cuyahoga | 1,393,978 | 11,167 | 726 | -10,441 |
| Darke | 53,309 | 126 | 0 | -126 |
| Defiance | 39,500 | 304 | 0 | -304 |
| Delaware | 109,989 | 201 | 0 | -201 |
| Erie | 79,551 | 379 | 0 | -379 |
| Fairfield | 122,759 | 239 | 1,659 | 1,420 |
| Fayette | 28,433 | 84 | 0 | -84 |
| Franklin | 1,068,978 | 4,706 | 630 | -4,076 |
| Fulton | 42,084 | 103 | 0 | -103 |
| Gallia | 31,069 | 47 | 0 | -47 |
| Geauga | 90,895 | 65 | 0 | -65 |
| Greene | 147,886 | 538 | 0 | -538 |
| Guernsey | 40,792 | 112 | 0 | -112 |
| Hamilton | 845,303 | 5,235 | 0 | -5,235 |
| Hancock | 71,295 | 239 | 0 | -239 |
| Hardin | 31,945 | 65 | 0 | -65 |
| Harrison | 15,856 | 37 | 0 | -37 |
| Henry | 29,210 | 89 | 0 | -89 |
| Highland | 40,875 | 117 | 0 | -117 |
| Hocking | 28,241 | 75 | 456 | 381 |
| Holmes | 38,943 | 47 | 0 | -47 |
| Huron | 59,487 | 131 | 0 | -131 |
| Jackson | 32,641 | 28 | 0 | -28 |
| Jefferson | 73,894 | 145 | 0 | -145 |
| Knox | 54,500 | 84 | 0 | -84 |
| Lake | 227,511 | 538 | 0 | -538 |
| Lawrence | 62,319 | 173 | 0 | -173 |
| Licking | 145,491 | 501 | 0 | -501 |
| Logan | 46,005 | 126 | 0 | -126 |
| Lorain | 284,664 | 1,343 | 3,691 | 2,348 |
| Lucas | 455,054 | 1,796 | 0 | -1,796 |
| Madison | 40,213 | 75 | 4,036 | 3,961 |
| Mahoning | 257,555 | 603 | 634 | 31 |
| Marion | 66,217 | 318 | 4,103 | 3,785 |
| Medina | 151,095 | 225 | 0 | -225 |
| Meigs | 23,072 | 47 | 0 | -47 |
| Mercer | 40,924 | 61 | 0 | -61 |
| Miami | 98,868 | 351 | 0 | -351 |
| Monroe | 15,180 | 56 | 0 | -56 |
| Montgomery | 559,062 | 2,241 | 724 | -1,517 |
| Morgan | 14,897 | 47 | 0 | -47 |
| Morrow | 31,628 | 37 | 0 | -37 |
| Muskingum | 84,585 | 370 | 0 | -370 |
| Noble | 14,058 | 37 | 2,039 | 2,002 |
| Ottawa | 40,985 | 80 | 0 | -80 |
| Paulding | 20,293 | 84 | 0 | -84 |
| Perry | 34,078 | 75 | 0 | -75 |
| Pickaway | 52,727 | 145 | 5,728 | 5,583 |
| Pike | 27,695 | 56 | 0 | -56 |
| Portage | 152,061 | 285 | 0 | -285 |
| Preble | 42,337 | 61 | 0 | -61 |
| Putnam | 34,726 | 70 | 0 | -70 |
| Richland | 128,852 | 589 | 4,612 | 4,023 |
| Ross | 73,345 | 164 | 4,507 | 4,343 |
| Sandusky | 61,792 | 145 | 0 | -145 |
| Scioto | 79,195 | 332 | 1,512 | 1,180 |
| Seneca | 58,683 | 267 | 0 | -267 |
| Shelby | 47,910 | 178 | 0 | -178 |
| Stark | 378,098 | 1,993 | 0 | -1,993 |
| Summit | 542,899 | 2,905 | 0 | -2,905 |
| Trumbull | 225,116 | 407 | 1,455 | 1,048 |
| Tuscarawas | 90,914 | 196 | 0 | -196 |
| Union | 40,909 | 112 | 1,755 | 1,643 |
| Van Wert | 29,659 | 84 | 0 | -84 |
| Vinton | 12,806 | 51 | 0 | -51 |
| Warren | 158,383 | 365 | 3,334 | 2,969 |
| Washington | 63,251 | 164 | 0 | -164 |
| Wayne | 111,564 | 178 | 0 | -178 |
| Williams | 39,188 | 126 | 0 | -126 |
| Wood | 121,065 | 154 | 0 | -154 |
| Wyandot | 22,908 | 51 | 0 | -51 |
Methodology
This report relies on Ohio Department of Rehabilitation and Corrections (DRC) data on the county of commitment distribution for all state prisoners admitted to custody during the year 2000. This data was then extrapolated to apply to the entire population under DRC custody in 2000. We verified that each state prison facility identified by the U.S. Census was in fact a state prison, and then we performed our analysis of facility size with the numbers reported in the Census.
While the Census Bureau designated correctional facilities by type (state, federal, local, etc.) we found we could not rely upon this designation for reasons that will be detailed in a subsequent national report. Steve Vandine and Senarath Dassanayaka at the Ohio Department of Rehabilitation and Correction graciously provided April 1 2000 population counts for each facility so we could be certain that each state facility was correctly accounted for in the Census data.
The analysis of the legislative districts was performed by geo-referencing a map of the state legislative districts over the prison locations as determined by the Census Bureau.
About the authors
Peter Wagner is Assistant Director of the Prison Policy Initiative, an Open Society Institute Soros Justice Fellow, and a 2003 graduate of the Western New England College School of Law. Mr. Wagner is the author of “Importing Constituents: Prisoners and Political Clout in New York” (April, 2002), the first systematic state analysis of the impact of prisoner enumeration policies on legislative redistricting. He has spoken and testified at numerous national and state forums on this topic. Mr. Wagner edits PrisonersoftheCensus.org and writes a weekly fact column for the website about the varied impacts on society from miscounting prisoners.
His most recent publications are “The Prison Index: Taking the Pulse of the Crime Control Industry” (April 2004) and with Eric Lotke, “Prisoners of the Census: Electoral and Financial Consequences of Counting Prisoners Where They Go, Not Where They Come From” (forthcoming, Pace Law Review).
Rose Heyer is the GIS Analyst for the Prison Policy Initiative. She developed the Geographic Information System research strategy for the Prisoners of the Census project and consults with other organizations on the use of GIS for criminal justice reform advocacy.
Her most recent publication is, with Peter Wagner, Too big to ignore: How counting people in prisons distorted Census 2000, the first national analysis of how Census counts of prisoners distort statistics on race, ethnicity, gender and income.
Acknowledgements
This research was supported by a grant from the Soros Justice Fellowship Program of the Open Society Institute.
About the Prison Policy Initiative
The Prison Policy Initiative (PPI) conducts research and advocacy on incarceration policy. Its work starts with the idea that the racial, gender and economic disparities between the prison population and the larger society represent the grounds for a democratic catastrophe. PPI’s concept of prison reform is based not only in opposition to a rising rate of incarceration, but in the search for a lasting solution to pressing social problems superior to temporarily warehousing our citizens in prisons and jails.
The Prison Policy Initiative is based in Northampton, Massachusetts. For more information about PPI or prison policy in general, visit http://www.prisonpolicy.org.
Recommended Reading:
About the Prison Policy Initiative
Learn more about the organization behind the Prison Gerrymandering Project.

In prisons, Blacks and Latinos do the time while Whites get the jobs
We explore the racial disparity inside prisons.

Rome NY ends prison gerrymandering, Census Bureau can do better
Rome finally corrected the problem of prison gerrymandering within its borders; other cities and counties need the Census Bureau's help.

Prison-based gerrymandering's historical precedent
This is not the first time a policy barred people of color from the polls and transferred their political power to white voters.