The Census Bureau pins down correctional facility locations
Census Bureau maps locations of correctional facilities, taking another step toward a more accurate count of incarcerated people.
by Peter Wagner, August 15, 2014
Last fall, the Census Bureau made an important addition to their TIGER mapping system: they added the “footprints” of all of the correctional facilities in the United States. Along with states, counties, cities, rivers, roads and all kinds of geographic entities, the Bureau now has a spatial database of adult prisons, jails, and juvenile institutions.
In my view, this is an essential inventory of the places where 1% of our adult population is currently confined and it should also help the Bureau to, if it so chooses, end the problem of “prison gerrymandering”. The Census Bureau currently tabulates incarcerated people as residents of the prison location, not as residents of their legal home addresses. When state and local governments leave this data uncorrected, they skew legislative districting and dilute the votes of everyone who does not live near a large prison. This new TIGER feature will help the Bureau count people at incarcerated facilities, thereby taking the first step to counting everyone in the right place — making sure they are in fact counted.
Now, for the first time, the Bureau has not just a list of all of the correctional facilities, but also their boundaries. This basic inventory will help in countless ways, ranging from answering basic geographic questions to more complicated population analyses. For example, the footprints will help the Bureau’s Count Question Resolution program settle the frequent disputes about whether a prison is in one community or just over the line in another. Knowing these facility footprints will also help in the Census Bureau’s goal of drawing better Census blocks; currently incarcerated and residential populations are often mixed in a single block. The footprints fulfill an important prerequisite to redrawing block boundaries near prisons so that the blocks follow the facility’s perimeter, thereby keeping the prison population in its own block, making it much easier to disentangle these populations for redistricting purposes or when conducting any population analysis.
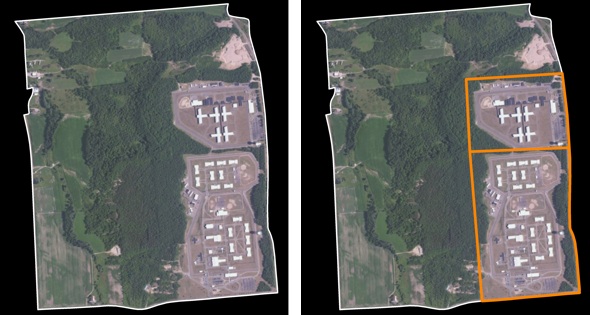
At left is a 2010 census block in Franklin County, New York that contains a number of residential houses and two prisons. The map at right shows, in orange, the Census Bureau’s separate footprints for the two state prisons displayed over the 2010 block map. Hopefully, these footprint maps will help with drawing blocks and counting the population for the 2020 Census.
Using the data
The Bureau has made this data available as part of its interactive TIGER system, and this spring we added these maps to our Correctional Facility Locator 2010 tool. Now that we’ve been using this internally for a few months, we wanted to share it with the rest of the people reading this blog.
As you may recall, our correctional facility locator is one of our data tools we developed to make it easier for experts and laypeople to use the Census Bureau’s Advance Group Quarters Summary File which for the first time published correctional facility counts early enough for use in redistricting. As then-director Robert Groves explained:
This decade we are releasing early counts of prisoners (and counts of other group quarters), so that states can leave the prisoners counted where the prisons are, delete them from the redistricting formulas, or assign them to some other locale.
And as we wrote last year, we’ve continued to add in our annotations of the 2010 Census’s group quarters data, including facility names, facility types, and linking in other data on the age, gender and race/ethnicity of the people confined there.
We’ve now added the Census Bureau’s correctional facility footprint data to our tools. If you search for a county in the 2010 Locator you will see a list of blocks that contain correctional facilities in that county along with our annotations. For each block you will also see a link to a map, a link to compare the correctional data for that area with the 2000 Census, a link to a detail page with additional demographic data and other material, and a new “Tiger facility footprint” link that will show the 2010 Census data and our annotations on the left with the Census Bureau’s new footprints data on the right. (See below.) We’ve also made all of the Census Bureau’s metadata on each facility available in a popup window when that facility is clicked on.
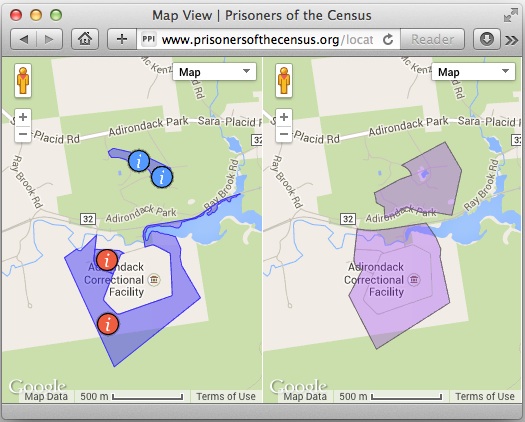
We’ve made the Census Bureau’s new facility footprint data available in our correctional facility locator. (Note, also, the improved spatial accuracy of the new data.)
The Census Bureau makes the periodic updates to its TIGER maps available to the public because it welcomes feedback that would improve its maps of roads, rivers, municipal boundaries, and any other geographies. We’ve already submitted two places where the correctional data could be improved, and our suggestions were quickly verified and accepted. We’re highlighting this new dataset in part so that other data users can start to examine the data and, if they see errors, make suggestions for improvements.
We’d like to see the Census Bureau update its interpretation of the usual residence rule and start to tabulate incarcerated people at their home addresses. One prerequisite is to further improve the Bureau’s understanding of exactly where the prisons are. And with this data, the Bureau is one step closer to achieving that goal.


