Outdated methodology impairs Census Bureau’s count of Black population
by Peter Wagner, May 3, 2004
Census 2000 showed a number of rural counties in the West, Midwest and Northeast that more than doubled their Black populations over the previous decade. Is this some sort of reversal of the great migration that saw millions of Blacks leave the rural South for Northern cities? Is a new economic opportunity drawing Blacks to leave cities for rural places? Not quite.
Most of the counties shown by the Census Bureau to have the fastest growing Black populations (see counties marked in purple in the first map below), are counties with new prisons with large incarcerated Black populations. (Compare with second map below.)
The Census Bureau counts incarcerated people as if they were residents of the prison town, even though prisoners have no contact with the outside community and are not there by choice. This methodology has staggering implications for how and where Black citizens are counted. On Census Day, 2.5% of Black Americans found themselves behind bars. Twelve percent of Black men in their 20s or early 30s are incarcerated. These figures are 7 to 8 times higher than the corresponding statistics for Whites. The Census Bureau’s method of counting the incarcerated disproportionately counts Blacks in the wrong place.
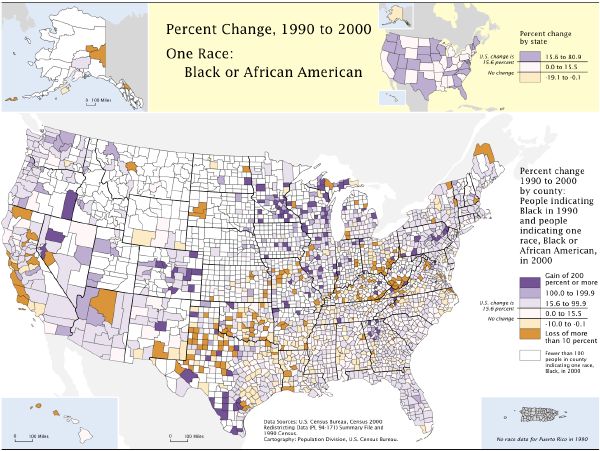
Figure 1. Many counties (in dark purple) report significant Black populations doubling in size from 1990 to 2000. In many of these cases, the cause is not willing Black migration, but the construction of new prisons. (Map source: U.S. Census Bureau, Mapping Census 2000: The Geography of U.S. Diversity.)
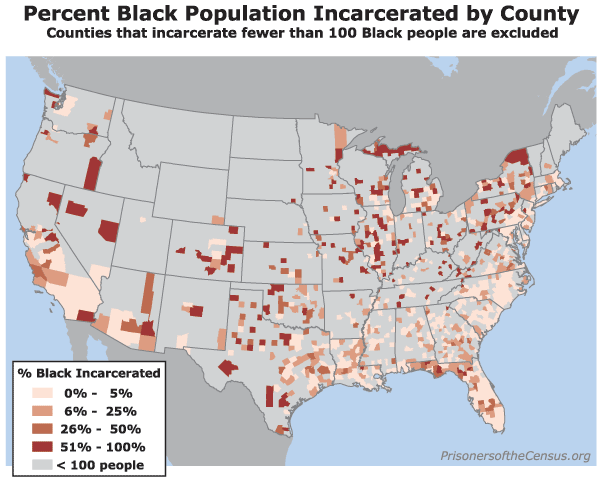
Figure 2. Many counties report that a large percentage of their Black population is incarcerated. Actually, these Black populations live somewhere else but are counted as county residents by the Census because they are incarcerated in the county.
Assigning the incarcerated to the prison address is an outdated method of collecting data that reduces the value of Census information about the racial makeup of our communities.
Brown County, Illinois, is the most extreme example. According to the Census, Brown County is 18% Black, more than all but 4 Illinois counties. Yet all but 5 of the 1,265 Blacks reported by the Census in Brown County are incarcerated residents of somewhere else. The large Black population of Brown County is a statistical fiction.
Brown County may have more of its Black population behind bars than any other county in the country, but it is not a unique glitch in the data. We found 256 counties that that have more than a quarter of their Black population behind bars. In 173 counties, more than half of the Black population is incarcerated. (See table below for list of counties. These figures deliberately understate our results, as we excluded from the above an additional 75 counties that have less than 100 Blacks incarcerated.)
This does not necessarily reflect a bias in counties’ criminal justice systems; rather it reflects a geographic bias in where prisons are located. Prisons are often located far from the communities where most of the prisoners come from. By relying on the racial and geographic bias of the prison industry to determine the residence of the incarcerated, the Census introduces a racial and geographic bias into its data.
The Census Bureau has been counting people at the prisons since the first Census in 1790, long before the data was used for demographic analysis or legislative redistricting. The Supreme Court didn’t coin the “One person one vote” principle, or require that state legislative districts comply with its requirement to draw equally sized districts until 1964. Congress didn’t mandate the Census Bureau to assist with state redistricting until 1975. High incarceration itself is quite new, having interfered only with the last two U.S. Censuses in 1990 and 2000. (See Figure 3.) Times have changed.
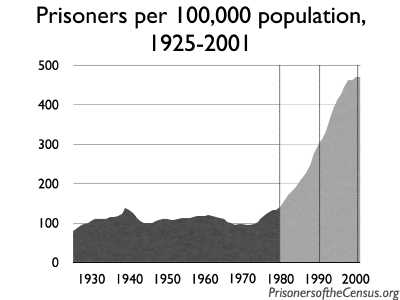
Figure 3. The 1980 Census was the last Census taken before incarceration rates began to skyrocket.
As the country and its needs for data evolved, the Census has regularly updated its counting methodology for other special populations like students and the military. The Census Bureau’s slogan is “Helping you make informed decisions”. If the Census Bureau wants to help policy makers make informed decisions about the size and growth of the Black population of the United States, it needs to change how it counts the incarcerated.
Counties with more than 50% of their Black Population incarcerated (excluding counties with less than 100 Black people incarcerated)
| County | State | 2000 population | Black population | Black population incarcerated | Percent of Black population incarcerated |
|---|---|---|---|---|---|
| Graham | Arizona | 33,489 | 625 | 391 | 63% |
| Izard | Arkansas | 13,249 | 191 | 168 | 88% |
| Del Norte | California | 27,507 | 1,184 | 1,081 | 91% |
| Lassen | California | 33,828 | 2,992 | 2,728 | 91% |
| Amador | California | 35,100 | 1,359 | 1,052 | 77% |
| Tuolumne | California | 54,501 | 1,146 | 964 | 84% |
| Imperial | California | 142,361 | 5,624 | 2,939 | 52% |
| Logan | Colorado | 20,504 | 420 | 313 | 75% |
| Kit Carson | Colorado | 8,011 | 139 | 133 | 96% |
| Lincoln | Colorado | 6,087 | 302 | 268 | 89% |
| Delta | Colorado | 27,834 | 146 | 116 | 79% |
| Chaffee | Colorado | 16,242 | 257 | 245 | 95% |
| Fremont | Colorado | 46,145 | 2,464 | 2,357 | 96% |
| Crowley | Colorado | 5,518 | 389 | 376 | 97% |
| Bent | Colorado | 5,998 | 219 | 181 | 83% |
| Huerfano | Colorado | 7,862 | 216 | 173 | 80% |
| Holmes | Florida | 18,564 | 1,208 | 791 | 65% |
| Liberty | Florida | 7,021 | 1,294 | 678 | 52% |
| Lafayette | Florida | 7,022 | 1,009 | 689 | 68% |
| Union | Florida | 13,442 | 3,070 | 1,776 | 58% |
| Gilchrist | Florida | 14,437 | 1,010 | 540 | 53% |
| Habersham | Georgia | 35,902 | 1,610 | 829 | 51% |
| Tazewell | Illinois | 128,485 | 1,131 | 813 | 72% |
| Pike | Illinois | 17,384 | 260 | 251 | 97% |
| Clinton | Illinois | 35,535 | 1,391 | 1,037 | 75% |
| Randolph | Illinois | 33,893 | 3,147 | 2,139 | 68% |
| Fulton | Illinois | 38,250 | 1,378 | 1,250 | 91% |
| Brown | Illinois | 6,950 | 1,265 | 1,260 | 100% |
| La Salle | Illinois | 111,509 | 1,723 | 895 | 52% |
| Livingston | Illinois | 39,678 | 2,053 | 1,727 | 84% |
| Logan | Illinois | 31,183 | 2,045 | 1,581 | 77% |
| Lee | Illinois | 36,062 | 1,772 | 1,318 | 74% |
| Edgar | Illinois | 19,704 | 362 | 295 | 81% |
| Christian | Illinois | 35,372 | 758 | 641 | 85% |
| Montgomery | Illinois | 30,652 | 1,143 | 1,039 | 91% |
| Fayette | Illinois | 21,802 | 1,064 | 1,038 | 98% |
| Crawford | Illinois | 20,452 | 927 | 785 | 85% |
| Bond | Illinois | 17,633 | 1,306 | 850 | 65% |
| Perry | Illinois | 23,094 | 1,851 | 1,430 | 77% |
| Hardin | Illinois | 4,800 | 132 | 117 | 89% |
| Johnson | Illinois | 12,878 | 1,825 | 1,789 | 98% |
| Parke | Indiana | 17,241 | 370 | 276 | 75% |
| Hendricks | Indiana | 104,093 | 1,162 | 789 | 68% |
| Putnam | Indiana | 36,019 | 1,057 | 707 | 67% |
| Sullivan | Indiana | 21,751 | 928 | 891 | 96% |
| Perry | Indiana | 18,899 | 274 | 250 | 91% |
| Jones | Iowa | 20,221 | 361 | 308 | 85% |
| Jasper | Iowa | 37,213 | 309 | 200 | 65% |
| Henry | Iowa | 20,336 | 302 | 156 | 52% |
| Page | Iowa | 16,976 | 282 | 178 | 63% |
| Norton | Kansas | 5,953 | 241 | 236 | 98% |
| Ellsworth | Kansas | 6,525 | 232 | 217 | 94% |
| Lyon | Kentucky | 8,080 | 543 | 427 | 79% |
| Oldham | Kentucky | 46,178 | 1,943 | 1,025 | 53% |
| Boyd | Kentucky | 49,752 | 1,267 | 641 | 51% |
| Morgan | Kentucky | 13,948 | 611 | 593 | 97% |
| Floyd | Kentucky | 42,441 | 546 | 314 | 58% |
| Lee | Kentucky | 7,916 | 300 | 265 | 88% |
| Clay | Kentucky | 24,556 | 1,178 | 831 | 71% |
| West Feliciana | Louisiana | 15,111 | 7,633 | 3,877 | 51% |
| Washington | Maryland | 131,923 | 10,247 | 5,199 | 51% |
| Allegany | Maryland | 74,930 | 4,006 | 2,139 | 53% |
| Baraga | Michigan | 8,746 | 436 | 422 | 97% |
| Marquette | Michigan | 64,634 | 853 | 600 | 70% |
| Gogebic | Michigan | 17,370 | 305 | 287 | 94% |
| Luce | Michigan | 7,024 | 528 | 515 | 98% |
| Alger | Michigan | 9,862 | 603 | 593 | 98% |
| Schoolcraft | Michigan | 8,903 | 145 | 132 | 91% |
| Iron | Michigan | 13,138 | 144 | 117 | 81% |
| Chippewa | Michigan | 38,543 | 2,127 | 2,020 | 95% |
| Crawford | Michigan | 14,273 | 214 | 170 | 79% |
| Manistee | Michigan | 24,527 | 399 | 342 | 86% |
| Arenac | Michigan | 17,269 | 315 | 297 | 94% |
| Montcalm | Michigan | 61,266 | 1,330 | 1,127 | 85% |
| Gratiot | Michigan | 42,285 | 1,572 | 1,468 | 93% |
| Lapeer | Michigan | 87,904 | 720 | 521 | 72% |
| Ionia | Michigan | 61,518 | 2,807 | 2,642 | 94% |
| Branch | Michigan | 45,787 | 1,206 | 1,016 | 84% |
| Carlton | Minnesota | 31,671 | 308 | 251 | 81% |
| Pine | Minnesota | 26,530 | 341 | 241 | 71% |
| Sherburne | Minnesota | 64,417 | 550 | 303 | 55% |
| Swift | Minnesota | 11,956 | 322 | 306 | 95% |
| Rice | Minnesota | 56,665 | 741 | 396 | 53% |
| Waseca | Minnesota | 19,526 | 441 | 302 | 68% |
| Webster | Missouri | 31,045 | 359 | 287 | 80% |
| DeKalb | Missouri | 11,597 | 1,028 | 979 | 95% |
| Livingston | Missouri | 14,558 | 339 | 193 | 57% |
| Cooper | Missouri | 16,670 | 1,493 | 793 | 53% |
| Moniteau | Missouri | 14,827 | 561 | 482 | 86% |
| Pike | Missouri | 18,351 | 1,682 | 993 | 59% |
| Washington | Missouri | 23,344 | 578 | 459 | 79% |
| St. Francois | Missouri | 55,641 | 1,126 | 856 | 76% |
| Pershing | Nevada | 6,693 | 358 | 340 | 95% |
| White Pine | Nevada | 9,181 | 380 | 344 | 91% |
| Carson City | Nevada | 52,457 | 946 | 657 | 69% |
| Hunterdon | New Jersey | 121,989 | 2,743 | 1,607 | 59% |
| Torrance | New Mexico | 16,911 | 280 | 155 | 55% |
| Clinton | New York | 79,894 | 2,863 | 2,043 | 71% |
| Franklin | New York | 51,134 | 3,389 | 3,147 | 93% |
| Essex | New York | 38,851 | 1,092 | 960 | 88% |
| Washington | New York | 61,042 | 1,785 | 1,543 | 86% |
| Greene | New York | 48,195 | 2,664 | 1,705 | 64% |
| St. Lawrence | New York | 111,931 | 2,664 | 1,816 | 68% |
| Cayuga | New York | 81,963 | 3,272 | 1,855 | 57% |
| Orleans | New York | 44,171 | 3,230 | 1,710 | 53% |
| Seneca | New York | 33,342 | 758 | 508 | 67% |
| Livingston | New York | 64,328 | 1,938 | 1,247 | 64% |
| Wyoming | New York | 43,424 | 2,395 | 2,290 | 96% |
| Avery | North Carolina | 17,167 | 598 | 525 | 88% |
| Williams | Ohio | 39,188 | 283 | 206 | 73% |
| Marion | Ohio | 66,217 | 3,805 | 2,146 | 56% |
| Union | Ohio | 40,909 | 1,149 | 886 | 77% |
| Madison | Ohio | 40,213 | 2,511 | 1,792 | 71% |
| Noble | Ohio | 14,058 | 940 | 923 | 98% |
| Pickaway | Ohio | 52,727 | 3,391 | 2,907 | 86% |
| Hocking | Ohio | 28,241 | 259 | 161 | 62% |
| Warren | Ohio | 158,383 | 4,327 | 2,424 | 56% |
| Alfalfa | Oklahoma | 6,105 | 256 | 244 | 95% |
| Woods | Oklahoma | 9,089 | 216 | 123 | 57% |
| Woodward | Oklahoma | 18,486 | 204 | 159 | 78% |
| Beckham | Oklahoma | 19,799 | 1,098 | 762 | 69% |
| Hughes | Oklahoma | 14,154 | 634 | 348 | 55% |
| Greer | Oklahoma | 6,061 | 532 | 331 | 62% |
| Yamhill | Oregon | 84,992 | 721 | 367 | 51% |
| Malheur | Oregon | 31,615 | 387 | 289 | 75% |
| Wayne | Pennsylvania | 47,722 | 757 | 395 | 52% |
| Clearfield | Pennsylvania | 83,382 | 1,239 | 1,079 | 87% |
| Northumberland | Pennsylvania | 94,556 | 1,439 | 903 | 63% |
| Union | Pennsylvania | 41,624 | 2,878 | 2,499 | 87% |
| Schuylkill | Pennsylvania | 150,336 | 3,147 | 2,401 | 76% |
| Huntingdon | Pennsylvania | 45,586 | 2,342 | 1,873 | 80% |
| Somerset | Pennsylvania | 80,023 | 1,275 | 1,166 | 91% |
| Greene | Pennsylvania | 40,672 | 1,585 | 1,356 | 86% |
| McKean | Pennsylvania | 45,936 | 860 | 745 | 87% |
| Yankton | South Dakota | 21,652 | 252 | 167 | 66% |
| Johnson | Tennessee | 17,499 | 424 | 356 | 84% |
| Lake | Tennessee | 7,954 | 2,481 | 1,406 | 57% |
| Morgan | Tennessee | 19,757 | 440 | 412 | 94% |
| Hickman | Tennessee | 22,295 | 1,009 | 553 | 55% |
| Bledsoe | Tennessee | 12,367 | 458 | 280 | 61% |
| Wayne | Tennessee | 16,842 | 1,145 | 1,019 | 89% |
| Pecos | Texas | 16,809 | 738 | 645 | 87% |
| Hartley | Texas | 5,537 | 451 | 432 | 96% |
| Childress | Texas | 7,688 | 1,083 | 754 | 70% |
| Dickens | Texas | 2,762 | 226 | 171 | 76% |
| Dawson | Texas | 14,985 | 1,297 | 860 | 66% |
| Mitchell | Texas | 9,698 | 1,242 | 962 | 77% |
| Jack | Texas | 8,763 | 486 | 404 | 83% |
| Wise | Texas | 48,793 | 600 | 308 | 51% |
| Parker | Texas | 88,495 | 1,586 | 926 | 58% |
| Jones | Texas | 20,785 | 2,392 | 1,810 | 76% |
| Medina | Texas | 39,304 | 866 | 597 | 69% |
| Karnes | Texas | 15,446 | 1,667 | 1,377 | 83% |
| Frio | Texas | 16,252 | 792 | 743 | 94% |
| Live Oak | Texas | 12,309 | 301 | 271 | 90% |
| Bee | Texas | 32,359 | 3,203 | 2,641 | 82% |
| La Salle | Texas | 5,866 | 208 | 180 | 87% |
| Willacy | Texas | 20,082 | 439 | 323 | 74% |
| Buchanan | Virginia | 26,978 | 708 | 470 | 66% |
| Bland | Virginia | 6,871 | 288 | 216 | 75% |
| Russell | Virginia | 30,308 | 934 | 721 | 77% |
| Grayson | Virginia | 17,917 | 1,217 | 833 | 68% |
| Clallam | Washington | 64,525 | 545 | 308 | 57% |
| Mason | Washington | 49,405 | 587 | 383 | 65% |
| Walla Walla | Washington | 55,180 | 930 | 535 | 58% |
| Randolph | West Virginia | 28,262 | 302 | 184 | 61% |
| Monroe | West Virginia | 14,583 | 872 | 736 | 84% |
| Jackson | Wisconsin | 19,100 | 433 | 339 | 78% |
| Crawford | Wisconsin | 17,243 | 233 | 157 | 67% |
| Marquette | Wisconsin | 15,832 | 545 | 499 | 92% |
| Sheboygan | Wisconsin | 112,646 | 1,224 | 661 | 54% |
| Columbia | Wisconsin | 52,468 | 460 | 339 | 74% |
| Dodge | Wisconsin | 85,897 | 2,142 | 1,916 | 89% |
Source: Rose Heyer and Peter Wagner, Too big to ignore: How counting people in prisons distorted Census 2000; Peter Wagner and Rose Heyer Thirty-Two Years After Attica: Many More Blacks in Prison but not as Guards; Bureau of Justice Statistics, Prison and Jail Inmates at Midyear 2000; and additional research by Rose Heyer and Peter Wagner.


