Prison expansion made 56 counties with declining populations appear to be growing in Census 2000
by Peter Wagner, April 26, 2004
Counting incarcerated people as if they were residents of the prison town leads to misleading portrayals of which counties are growing and which are declining. Declining populations in a county are often a sign of economic distress. Census 2000 reported that 78% of counties experienced population growth during the 1990s. Yet 56 of these counties can attribute their growth only to prison expansion and not to children being born or new residents choosing to move to the county. Said another way, for each 50 counties labeled by the Census as growing during the 1990s, one of those counties actually saw a decline in their actual free population. (See map and table.)
Most of these counties with disguised declining populations have significant incarcerated populations. More than half have at least 1,000 people behind bars. Six of these counties were also featured in last week’s column Twenty one counties have twenty one percent of their population in prisons and jails. In some counties, the reported growth was slight, but in others, it appeared huge. Jones County Texas saw its Census population rise by 26%. During the 1990s, 355 residents of Jones County chose to pack up and leave the County. At the same time, the state of Texas sent 4,650 prisoners to be incarcerated there.
Incarceration has risen nationally over the last decade, but that’s not true everywhere. Frontier County Nebraska and Clay County Georgia would have reported small population increases had these counties’ populations not included a declining number of prisoners.
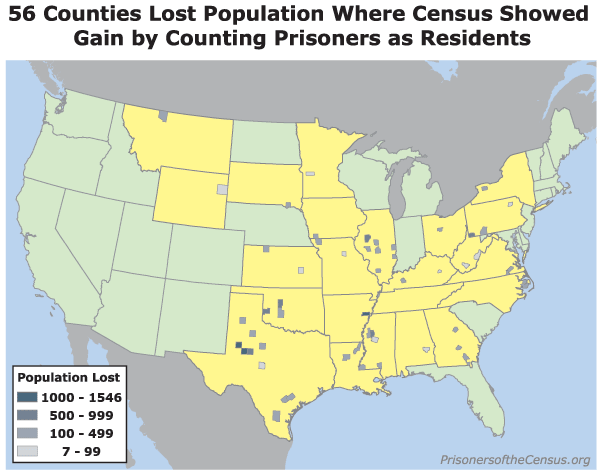
Census 2000 reported how many counties grew during the 1990s and how many declined. But if not for the construction of new prison cells, 56 counties labeled as growing would have reported declining populations or no growth at all.
| County | State | Growth Reported in Census | Actual Population Decline | Percent of County population incarcerated | Percent of County that is rural | County is metro or non-metro county |
|---|---|---|---|---|---|---|
| Bullock County | AL | 672 | 86 | 11.93% | 64.67% | Nonmetro |
| St. Francis County | AR | 832 | 1,529 | 8.27% | 51.29% | Nonmetro |
| Hancock County | GA | 1,168 | 199 | 13.57% | 59.77% | Nonmetro |
| Telfair County | GA | 794 | 402 | 11.25% | 57.27% | Nonmetro |
| Ware County | GA | 12 | 459 | 4.20% | 28.40% | Nonmetro |
| Morgan County | IL | 219 | 162 | 2.87% | 35.79% | Nonmetro |
| Fulton County | IL | 170 | 860 | 5.16% | 53.92% | Nonmetro |
| Logan County | IL | 385 | 387 | 7.72% | 41.45% | Nonmetro |
| Edgar County | IL | 109 | 275 | 2.00% | 52.42% | Nonmetro |
| Christian County | IL | 954 | 243 | 3.45% | 43.61% | Nonmetro |
| Crawford County | IL | 988 | 248 | 6.05% | 59.30% | Nonmetro |
| Perry County | IL | 1,682 | 490 | 9.50% | 55.69% | Nonmetro |
| Page County | IA | 106 | 484 | 4.74% | 34.55% | Nonmetro |
| Norton County | KS | 6 | 229 | 11.66% | 37.41% | Nonmetro |
| Chase County | KS | 9 | 61 | 2.31% | 100.00% | Nonmetro |
| Muhlenberg County | KY | 521 | 360 | 2.90% | 67.30% | Nonmetro |
| Lee County | KY | 494 | 87 | 7.50% | 100.00% | Nonmetro |
| West Carroll Parish | LA | 221 | 336 | 4.70% | 100.00% | Nonmetro |
| Richland Parish | LA | 352 | 258 | 3.19% | 64.04% | Nonmetro |
| Winn Parish | LA | 625 | 400 | 9.05% | 64.37% | Nonmetro |
| Swift County | MN | 1,232 | 90 | 11.15% | 47.57% | Nonmetro |
| Sunflower County | MS | 1,502 | 432 | 13.65% | 36.33% | Nonmetro |
| Leflore County | MS | 606 | 539 | 3.30% | 21.30% | Nonmetro |
| Holmes County | MS | 5 | 43 | 0.30% | 72.14% | Nonmetro |
| Marion County | MS | 51 | 301 | 1.49% | 69.40% | Nonmetro |
| Wilkinson County | MS | 634 | 269 | 9.18% | 100.00% | Nonmetro |
| Nodaway County | MO | 203 | 314 | 2.45% | 47.14% | Nonmetro |
| Randolph County | MO | 293 | 61 | 7.42% | 52.00% | Nonmetro |
| Toole County | MT | 221 | 106 | 6.27% | 42.57% | Nonmetro |
| Genesee County | NY | 310 | 128 | 0.82% | 59.72% | Metro |
| Hyde County | NC | 415 | 142 | 9.89% | 100.00% | Nonmetro |
| Tyrrell County | NC | 293 | 130 | 10.29% | 100.00% | Nonmetro |
| Marion County | OH | 1,943 | 144 | 6.20% | 31.07% | Nonmetro |
| Blaine County | OK | 506 | 837 | 11.29% | 61.16% | Nonmetro |
| Caddo County | OK | 600 | 118 | 2.57% | 80.70% | Nonmetro |
| Beckham County | OK | 987 | 595 | 8.12% | 30.71% | Nonmetro |
| Wyoming County | PA | 4 | 7 | 0.19% | 84.95% | Metro |
| Somerset County | PA | 1,805 | 374 | 2.80% | 74.77% | Metro |
| Greene County | PA | 1,122 | 794 | 5.44% | 68.19% | Nonmetro |
| Bon Homme County | SD | 171 | 111 | 10.62% | 100.00% | Nonmetro |
| Lake County | TN | 825 | 405 | 26.57% | 100.00% | Nonmetro |
| Swisher County | TX | 245 | 337 | 7.04% | 39.72% | Nonmetro |
| Dickens County | TX | 191 | 284 | 17.27% | 100.00% | Nonmetro |
| Dawson County | TX | 636 | 1,530 | 14.60% | 18.22% | Nonmetro |
| Howard County | TX | 1,284 | 1,546 | 11.77% | 21.79% | Nonmetro |
| Mitchell County | TX | 1,682 | 835 | 26.13% | 31.96% | Nonmetro |
| Jones County | TX | 4,295 | 355 | 22.53% | 60.89% | Nonmetro |
| Concho County | TX | 922 | 59 | 32.75% | 100.00% | Nonmetro |
| DeWitt County | TX | 1,173 | 157 | 6.75% | 52.27% | Nonmetro |
| Karnes County | TX | 2,991 | 360 | 21.74% | 38.42% | Nonmetro |
| Duval County | TX | 202 | 305 | 3.92% | 47.13% | Nonmetro |
| Sussex County | VA | 2,256 | 100 | 19.24% | 100.00% | Nonmetro |
| Greensville County | VA | 2,707 | 320 | 26.19% | 64.37% | Nonmetro |
| Pocahontas County | WV | 123 | 91 | 2.41% | 100.00% | Nonmetro |
| Raleigh County | WV | 2,401 | 19 | 3.21% | 40.75% | Nonmetro |
| Weston County | WY | 126 | 18 | 2.92% | 55.64% | Nonmetro |
Source: Rose Heyer and Peter Wagner, Too big to ignore: How counting people in prisons distorted Census 2000 and additional research by Rose Heyer and Peter Wagner.


