by Peter Wagner,
December 27, 2004
By Brent Staples
New York Times
December 27, 2004
The mandatory sentencing fad that swept the United States beginning in the 1970’s has had dramatic consequences — most of them bad. The prison population was driven up tenfold, creating a large and growing felon class — now 13 million strong — that remains locked out of the mainstream and prone to recidivism. Trailing behind the legions of felons are children who grow up visiting their parents behind bars and thinking prison life is perfectly normal. Meanwhile, the cost of building and running prisons has pushed many states close to bankruptcy — and forced them to choose between building jails and schools.
Seldom has a public policy done so much damage so quickly. But changes in the draconian sentencing laws have come very slowly. That is partly because the public thinks keeping a large chunk of the population behind bars is responsible for the reduced crime rates of recent years. Studies cast doubt on that theory, since they show drops in crime almost everywhere — even in states that did not embrace mandatory minimum sentences or mass imprisonment. In addition, these damaging policies have done nothing to curb the drug trade.
Changing prison policy, however, is no longer a simple matter. The business of building and running the jailhouse has become a mammoth industry with powerful constituencies that favor the status quo. Prison-based money and political power have distorted the legislative landscape in ways that will be difficult to undo.
These problems are on vivid display in New York, which started mass imprisonment when Gov. Nelson Rockefeller persuaded the Legislature to pass the toughest drug laws in the nation at the start of an ill-starred “war on drugs” 30 years ago. The Rockefeller laws introduced the country to mandatory sentencing policies that barred judges from deciding who goes to jail and for how long. Instead, the laws required lengthy sentences — 15 years to life — for nonviolent, first-time offenders, many of whom would have received brief sentences, drug treatment or community service under previous laws.
Nearly all of the prisoners ended up in upstate New York, where failing farms and hollowed-out cities offered a lot of room for building. Politicians in these sparsely populated districts caught on quickly and began to lobby to have the new prisons located in their communities. As a result, nearly 30 percent of the people who were counted as moving into upstate New York during the 1990’s were prison inmates.
The influx of inmates has brought desperately needed jobs to the region and resulted in districts whose economies revolve around prison payrolls and whose politics are dominated by the union that represents corrections officers. The inmates also helped to save political careers in areas where legislative districts were in danger of having to be merged because of shrinking populations. Inmates, as it turned out, were magically transformed into “residents,” thanks to a quirk in the census rules that counts them as living at their prisons. Although people sentenced under the drug laws frequently serve long sentences, many prisoners remain behind bars only briefly before returning to homes that are often hundreds of miles away.
Felons are barred from voting in 48 of 50 states — including New York. Yet in New York, as in the rest of the country, disenfranchised prisoners are included in the population counts that become the basis for drawing legislative districts.
An eye-opening analysis by Prison Policy Initiative’s Peter Wagner found seven upstate New York Senate districts that meet minimal population requirements only because prison inmates are included in the count. New York is not alone. The group’s researchers have found 21 counties nationally where at least 21 percent of the “residents” were inmates.
The New York Republican Party uses its majority in the State Senate to maintain political power through fat years and lean. The Senate Republicans, in turn, rely on their large upstate delegation to keep that majority. Whether those legislators have consciously made the connection or not, it’s hard to escape the fact that bulging prisons are good for their districts. The advantages extend beyond jobs and political gerrymandering. By counting unemployed inmates as residents, the prison counties lower their per capita incomes — and increase the portion they get of federal funds for the poor. This results in a transfer of federal cash from places that can’t afford to lose it to places that don’t deserve it.
Lately, polls have shown growing support for drug law reform. In November, prominent New York Republicans ran into trouble when they faced candidates who made Rockefeller reform an issue. In response, the State Senate endorsed a plan that cut sentences for drug possession crimes, which was the easy part. But it stonewalled on the crucial change, which would have returned to judges the discretion to sentence at least some offenders to drug treatment instead of prison.
While other political forces support the mandatory sentences — most notably the powerful local prosecutors — prison rights advocates have recently begun to argue that prison district politicians are more concerned about keeping the prisons full than about crime. The idea of counting inmates as voters in the counties that imprison them is particularly repulsive given that inmates are nearly always stripped of the right to vote. The practice recalls the early United States under slavery, when slaves were barred from voting but counted as three-fifths of a person for purposes of apportioning representation in Congress.
by Peter Wagner,
December 20, 2004
Current system favors rural counties at the Nevada Legislature
The Census Bureau’s method of counting prisoners reduces the population of Nevada’s urban areas and transfers political clout to rural districts, according to a report released last week by the Prison Policy Initiative, an organization that conducts research and advocacy on incarceration policy, and the Progressive Leadership Alliance of Nevada.
A little known quirk in the Census counts people in prison as if they were residents of the prison town. “This inflates the population of rural areas that host prisons, and shortchanges the areas most prisoners come from,” said report author Peter Wagner.
Nevada’s prison population grew five times larger from 1980 to 2000, which accentuates the problem. The biggest beneficiary of this Census counting practice is Pershing County, one of the 21 counties in the country that has at least 21% of its Census population in prison.
The largest losers are Reno and Las Vegas where most of the prisoners come from, and anyone who needs accurate statistics. For example, the Census reports that Pershing County more than doubled its Black population in the 1990s. But that is the prison population growing, not the actual residents of the county.
Continue reading →
by Peter Wagner,
December 13, 2004
As Rose Heyer and I wrote in Too Big to Ignore, How counting people in prisons distorted Census 2000, the Census Bureau’s decision to count incarcerated people as residents of the places with the prisons rather of their homes, leads to distorted data and some misleading conclusions about our communities. We wrote that statistics about size, growth, wealth, race, ethnicity and gender of communities are all affected.
Until recently, no online mapping tool existed to help you locate correctional facilities. The only two options were to hope that exactly what you needed has already been published on this website, or find the populations yourself in the particular tables of the text-based American Factfinder from the Census Bureau. Given the complexity of Census Bureau geography, this is complex task without the assistance of maps.
Bill Cooper of Fairdata2000 has added the various group quarters populations to his excellent online mapping tool for income, housing, language, and education statistics. The new tool allows researchers to look at counties or smaller levels of geography and see what percentage of the population consists of people in correctional facilities. He has also provided downloadable versions of this data to help other facilitate further analysis by more advanced users.
Continue reading →
by Peter Wagner,
December 6, 2004
Like most states, Idaho relies on U.S. Census data to draw its legislative districts. Districts are redrawn each decade so that each districts is of equal size. Having equal numbers of people in each legislative district ensures that each person in that district has an equal access to government. This concept is known as the “One Person One Vote” rule, but it breaks down when the U.S. Census data does not reflect the actual population of the state.
By Idaho statute, when a person is incarcerated his or her residence remains where he or she lived prior to incarceration:
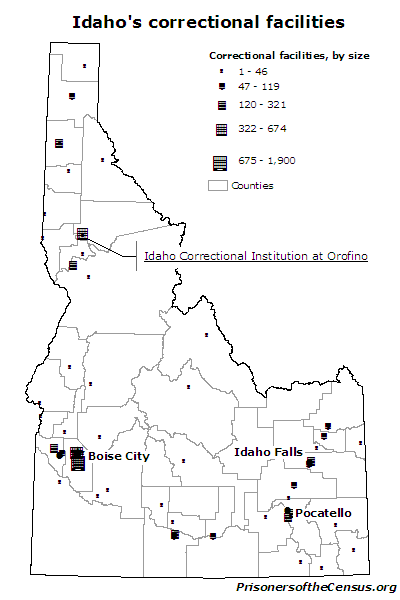
Almost 6% of Clearwater County’s Census population is incarcerated. It’s not the most punitive county in the state; it just happens to have a small population and the large Idaho Correctional Institution at Orofino filled with residents from other parts of Idaho.
“no person shall be deemed to have gained or lost a residence … while kept in any state institution at public expense.” Idaho Code § 34-405 (2003)
Yet, the Census Bureau, following its “usual residence rule” — first developed in 1790 long before state redistricting was envisioned — counts the incarcerated as residents of the town that contains the prisons rather than of their home communities.
This can radically change how the Census Bureau portrays certain Idaho communities. For example, almost 6% of the population reported in the Census for Clearwater County consists of prisoners counted at the Idaho Correctional Institution at Orofino.
Continue reading →
by Peter Wagner,
November 29, 2004
When the Census Bureau began counting Americans in 1790, it really didn’t matter that they decided to count prisoners as residents of the prison. The data was only used for one purpose: to gauge the relative populations of each state to determine how many seats in Congress each received. It didn’t matter where in a state prisoners were counted because legislative redistricting didn’t yet exist. Until 1900, most federal prisoners were kept in state prisons, so even these miniscule numbers were not crossing state lines. For more than a century, the impact on the distribution of political power from the Census Bureau’s decision on where to count prisoners appears to have been: zero.
In 1880, there was only one federal prison and 61 state prisons. At that time, the United States had only 61 people in prison for every 100,000 people in the population. That’s just above one-twentieth of one percent. It’s a tiny figure that reflects just how rare incarceration was.
By 1923, the federal prison system had grown to 3 prisons, but the state system had the same number of facilities. The prison population had grown but it was growing only ever so slightly faster than the overall population in the period. In 1923, the incarceration rate in the United States was, by Census Bureau figures, 74 per 100,000.
Drawing state legislative districts somewhat on the basis of population became more prevalent around this time, but there was not a clear federal requirement that states must regularly redistrict on the basis of strict population equality until a series of court cases beginning in 1963. Prison populations were, at worst, very minimal blips in the data.
Until the 1990 Census, when the incarceration rate shot to 292, there was very little change in the portion of Americans that were confined in state or federal prisons. By 2000, the number of prisons had skyrocketed to 1,668 and the prison incarceration rate had risen to 478 per 100,000. That’s almost one half of one percent of the U.S. population being in state or federal prison. (If jails were included, the numbers would be higher at 702 per 100,000 but historical comparisons would not be possible.)
Incarceration is of course not evenly distributed in the population, and the racial disparity has been increasing. In 1923, Blacks were incarcerated at a rate 4 times higher than Whites. By 2000, the disparity had almost doubled. At the time of the 2000 Census, just under 3.5% of Black men were in prison and being counted as “residents” not of their homes but of often distant prison towns.
If we want a fair and accurate count of every American community, then the Census Bureau must change how it counts incarcerated people. Two hundred years ago, both our population and how we used Census data were quite different. Only the two most recent Censuses were seriously distorted by high incarceration, and if the Census Bureau changes policy soon, they can be the last.
by Peter Wagner,
November 22, 2004
This week’s fact of the week is an editorial by the New York Times Editorial Board calling for the Census Bureau to change how it counts prisoners:
Jailhouse Blues
EDITORIAL
Published: November 22, 2004
The founding fathers envisioned a simple head count when they decreed that the country would conduct a census once every 10 years for the purpose of apportioning representation in Congress. Over the centuries, the question of who lives where has become more complicated. The census already has to determine where retirees with two homes live or how to count people who live in one city and work in another. It should be simpler counting prisoners.
A quirk in the residency rules counts inmates as “residents” of the prisons even though most are held only for brief periods before returning to their actual homes, which are often hundreds of miles away. The current system clashes with the principle of one person, one vote – by artificially inflating the populations of rural electoral districts and leaving the urban areas to which the prisoners will return underrepresented, particularly in state legislatures.
This prison census was less significant 30 years ago, when the prison population was less than 200,000. But mandatory sentencing policies for drug offenses have driven the prison population across the nation to a staggering 1.4 million. These new offenders are overwhelming black and Hispanic people from inner cities. The prison construction boom, however, has taken place mainly in white, rural counties that have since turned prison inmates into a kind of cash crop.
The citizens of large cities like New York, Chicago and Los Angeles have helped to pay the cost of building and maintaining state prisons, which provide much-needed jobs in many rural districts. They did not, however, count on also giving these generally underpopulated areas extra political influence as well.
The nonvoting inmates – sometimes called “imported constituents” – are often counted in rural districts where legislators vote against the interest of their home cities. Their presence in the census count of prison neighborhoods distorts population statistics and creates legislative districts that fly in the face of federal laws requiring districts to be roughly the same size – plus or minus a variation of about 5 percent. A recent series of reports – from the Brennan Center for Justice at New York University, the Prison Policy Initiative in Massachusetts and the Urban Institute in Washington – shows that many states have achieved the appearance of parity by drawing the state legislative districts in rural areas so that they include the largest possible number of inmates. Among the 10 states that have experienced the most prison growth, there are more than a dozen counties where at least one in five “residents” is an inmate.
The simplest and fairest solution would be to permit inmates to fill out census forms with their home addresses instead of automatically counting them as residents of the prison county. Most prisoners will have returned to their hometowns long before the next census rolls around. There, they will often be in need of both government services and political consideration.
by Peter Wagner,
November 15, 2004
Like most states, South Dakota relies on U.S. Census data to draw its legislative districts. Districts are redrawn each decade so that each districts is of equal size. Having equal numbers of people in each legislative district ensures that each person in that district has an equal access to government. This concept is known as the “One Person One Vote” rule, but it breaks down when the U.S. Census data does not reflect the actual population of the state.
By South Dakota statute, when a person is incarcerated his or her residence remains where he or she lived prior to incarceration:
“A person who has left home and gone into another … county … for a temporary purpose only has not changed his or her residence.” S.D. Codified Laws Sect. 12-1-4 (2003)
Yet, the Census Bureau, following its “usual residence rule” — first developed in 1790 long before state redistricting was envisioned — counts the incarcerated as residents of the town that contains the prisons rather than of their home communities.
Pennington County, which contains Rapid City, has 12% of South Dakota’s population but supplies 24% of the state’s prisoners. At the time of the Census, the county contained no state prisons, so these incarcerated residents of Pennington County were credited to other parts of the state.
Prisoners are not allowed to vote in South Dakota, but the presence of disenfranchised prisoners in the Census counts of prison towns swells the population and political power of those districts at the expense of the prisoner’s home communities. This issue should be of particular concern to Native American communities in South Dakota, because Native Americans are incarcerated at almost 4 times the rate of White people in the state.
According to my analysis of South Dakota legislative districts, 3 districts are at least 3% incarcerated prisoners. In one district, more than 6% of the Census population is behind bars. In these districts, a sizable portion of the district is from somewhere else, making a vote by a real resident of that district more powerful than a vote elsewhere in the state.
Continue reading →
by Peter Wagner,
November 14, 2004
I’ve posted a new report showing how the Census Bureau’s method of counting prisoners as residents of the rural areas that host prisons skews the democratic process in Montana.
The report identifies one district, House District 85 that counts among its census population 1,308 incarcerated people. The District is 14.5% prisoners, a higher figure than in any other state legislative district yet discovered in the United States. Prisoners can’t vote in Montana, and on their release they will be returning to their home communities, but their presence at the prison town in the Census dilutes the votes of their family members back home. Every group of 85 residents in District 85 gets as much of a say over state affairs as 100 people in elsewhere in the state. The Supreme Court’s ‘One Person One Vote’ rule was supposed to eliminate such large difference in voting power.
by Peter Wagner,
November 8, 2004
The Census Bureau counts incarcerated people as if they were residents of the towns that contain the prisons and jails. Thanks to the rapid rise in incarceration over the last 20 years, this once obscure quirk results in a significant boost to Texas’ rural areas that host prisons while reducing the population of the urban areas where most prisoners come from.
States are required to redraw their legislative boundaries each decade so that each will contain the same number of people as required by the 14th Amendment’s One Person One Vote principle. Equally sized districts ensure that each resident has an equal access to government regardless of where she or he lives.
This concept breaks down when the Census data doesn’t reflect where people actually live, in this case the 244,363 people in the Census counted as residents of correctional institutions. My newest report, Importing Constituents: Prisoners and Political Clout in Texas, found one legislative district, House District 13 (which includes Walker county, represented by Lois Kolkhorst) that counts among its census population 16,670 incarcerated people. The District is 12% prisoners, a higher figure than in any other state legislative district yet discovered in the United States.
Prisoners can’t vote in Texas, and on their release they will be returning to their home communities, but their presence at the prison town in the Census dilutes the votes of their family members back home. Every group of 88 residents in District 13 gets as much of a say over state affairs as 100 people in Houston or Dallas. This is exactly the kind of regional inequality in voting power that the Supreme Court’s ‘One Person One Vote’ rule was supposed to eliminate.
Source: Importing Constituents: Prisoners and Political Clout in Texas.
by Peter Wagner,
November 1, 2004
Previous articles have discussed individual counties in California and New York that have decided after public outcry to exclude incarcerated non-resident populations from their populations for purposes of local redistricting. This article looks at how 5 state legislatures and attorneys general have responded to the severe problem caused by the combination of an outdated Census Bureau “usual residence rule” and a rapidly growing population of prisoners incarcerated far from their homes. In four of these states, the state officials either required or encouraged the removal of prison populations.
Continue reading →


